Diane Bartsch
Diane Bartsch
Your Carson Valley REALTOR®
Certified Residential Specialist
(775) 781-5050
  • Home
  • Welcome Package
  • Neighborhoods
  • Newsletter
  • Buyers & Sellers
    • Helpful Resources
    • What’s My Home Worth
    • Area Information Center
  • Blog
  • About
    • About Me
    • Testimonials
    • Privacy Policy
  • Contact
Home > Local Market Statistics > Page 2

Monthly Market Report

January 19, 2024 by admin

Every month we take a look at the latest real estate market report to determine what kind of market we are in. This real-time market profile provided by Stewart Title shows the median list price of homes in the subject area, average days on the market for a listing, inventory of homes for sale, and more. As a result of all this data, the report provides us with a “Market Action Index”. An index below 30 points is considered a buyer’s market and an index above 30 is considered a seller’s market.

Are you curious what your home is worth in this market? Head on over to “What’s MY Home Worth” to get in touch and find out.

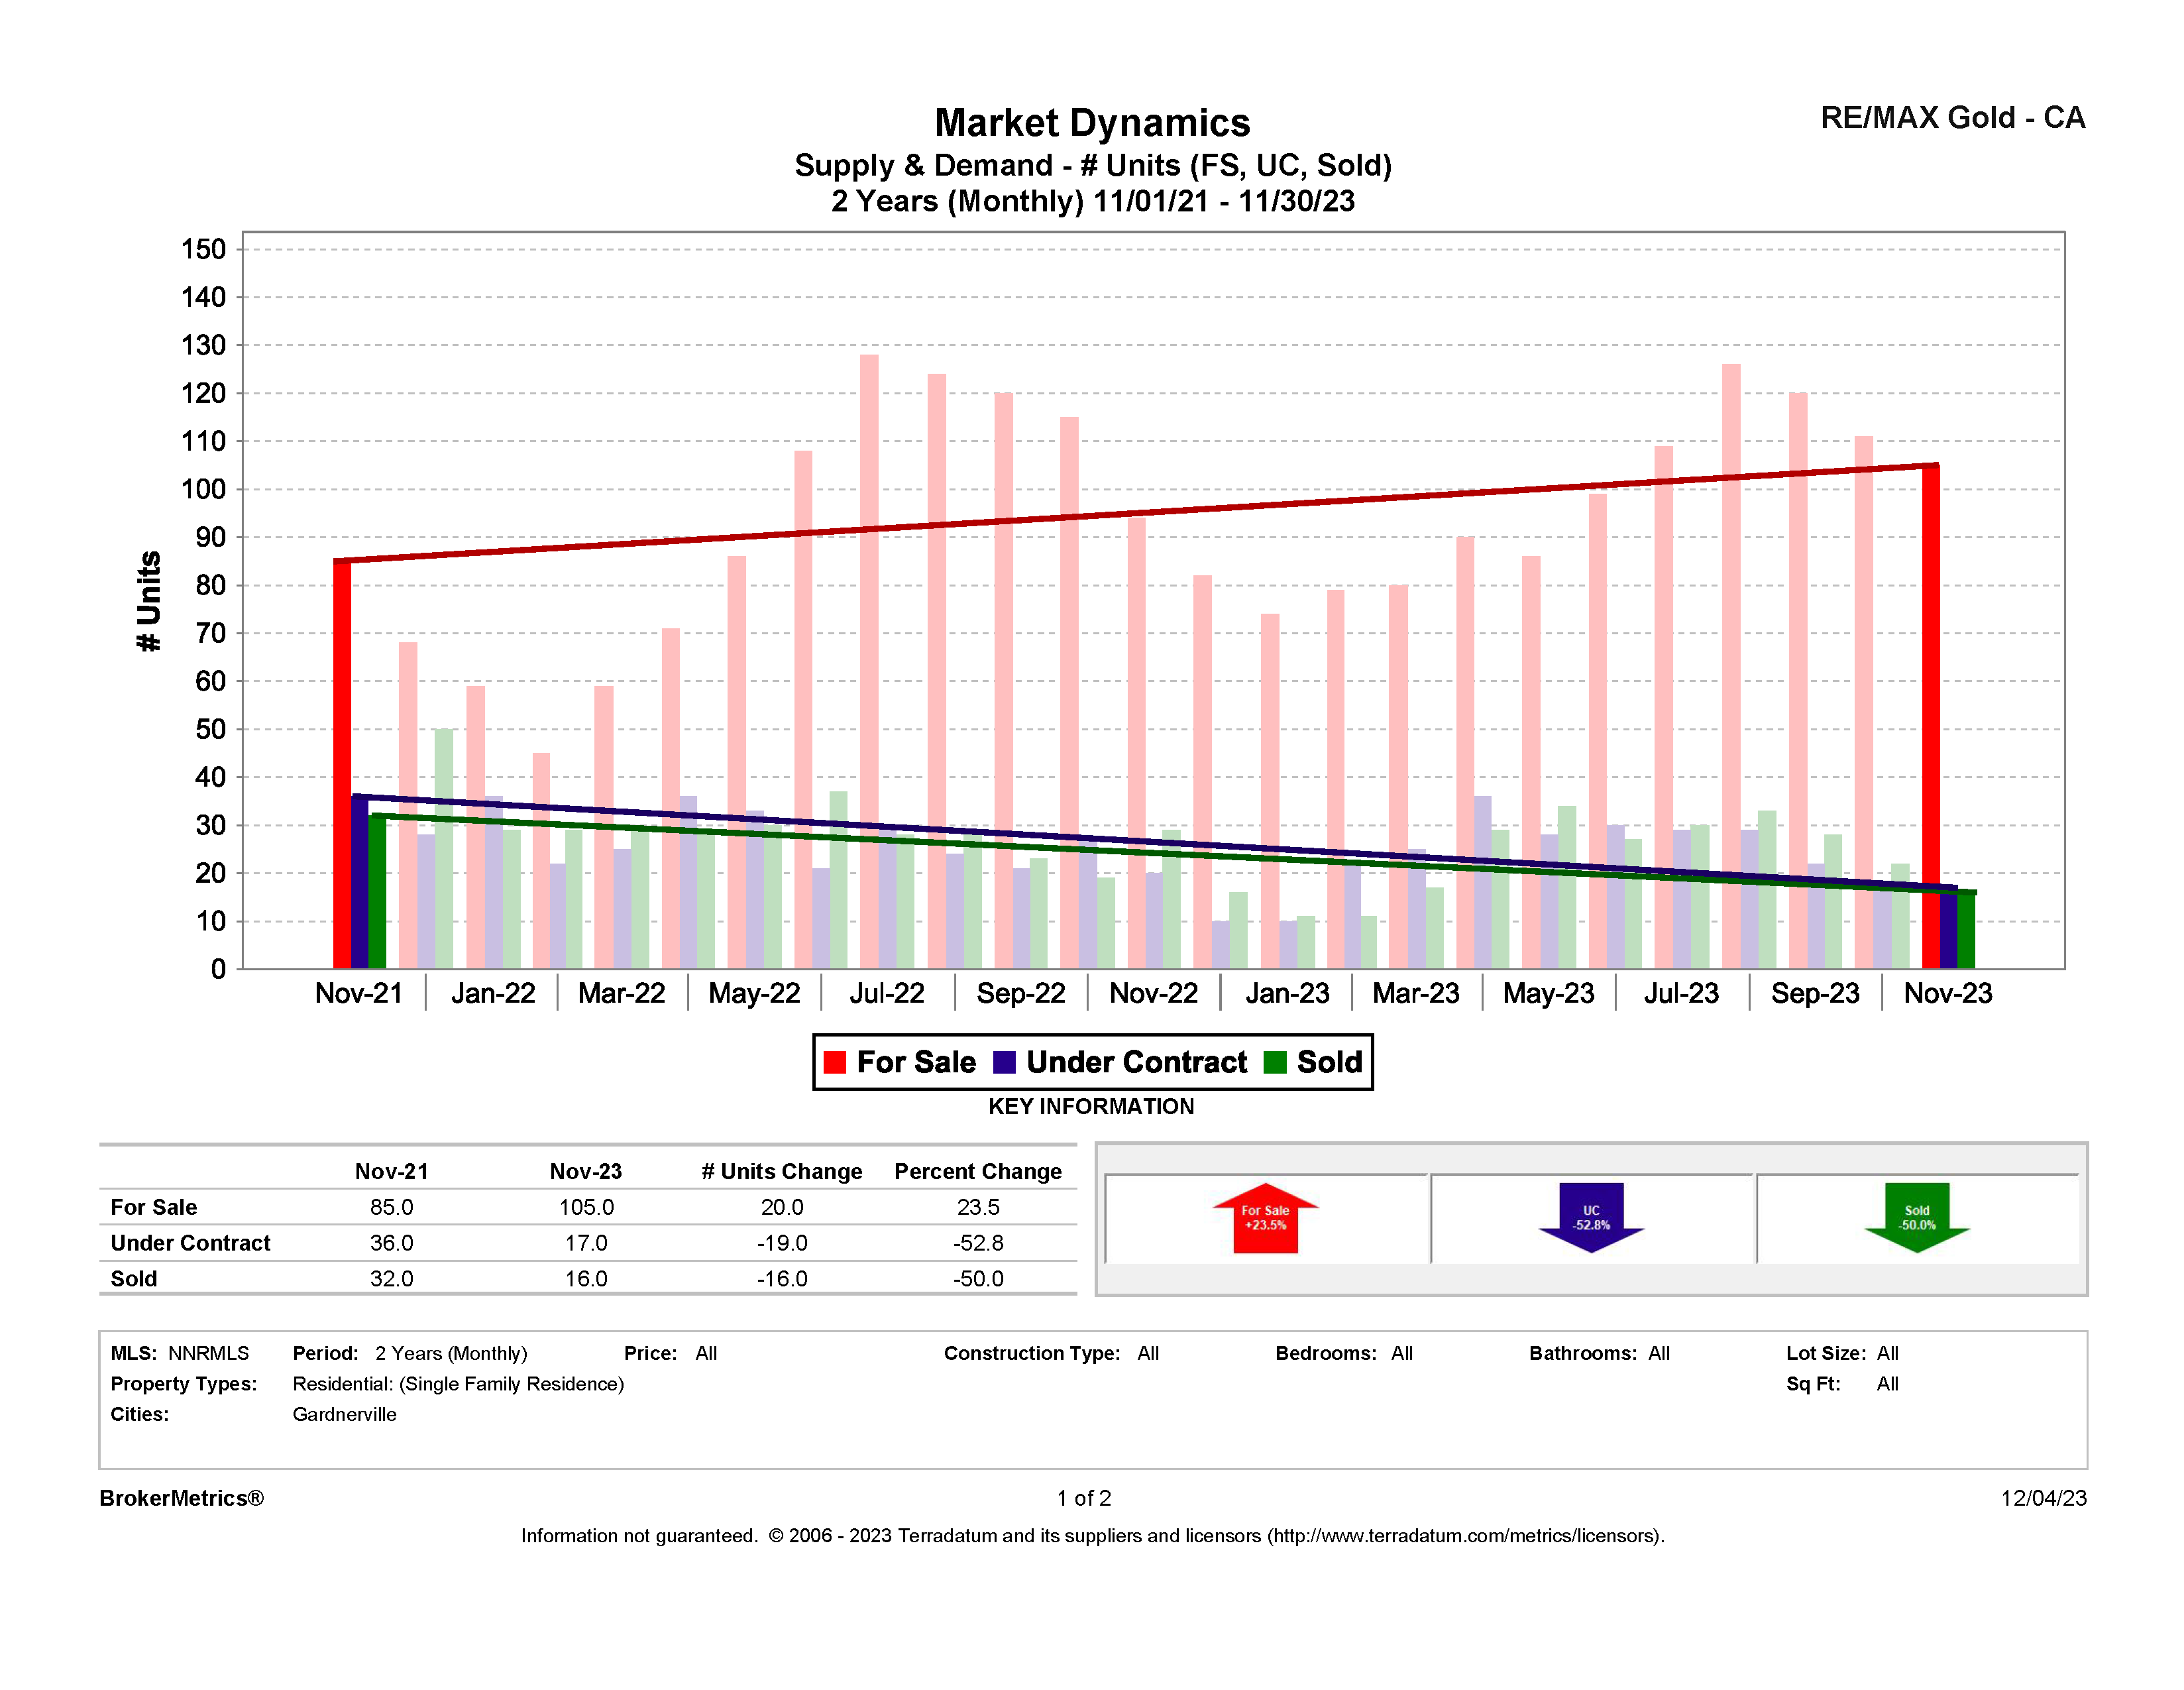
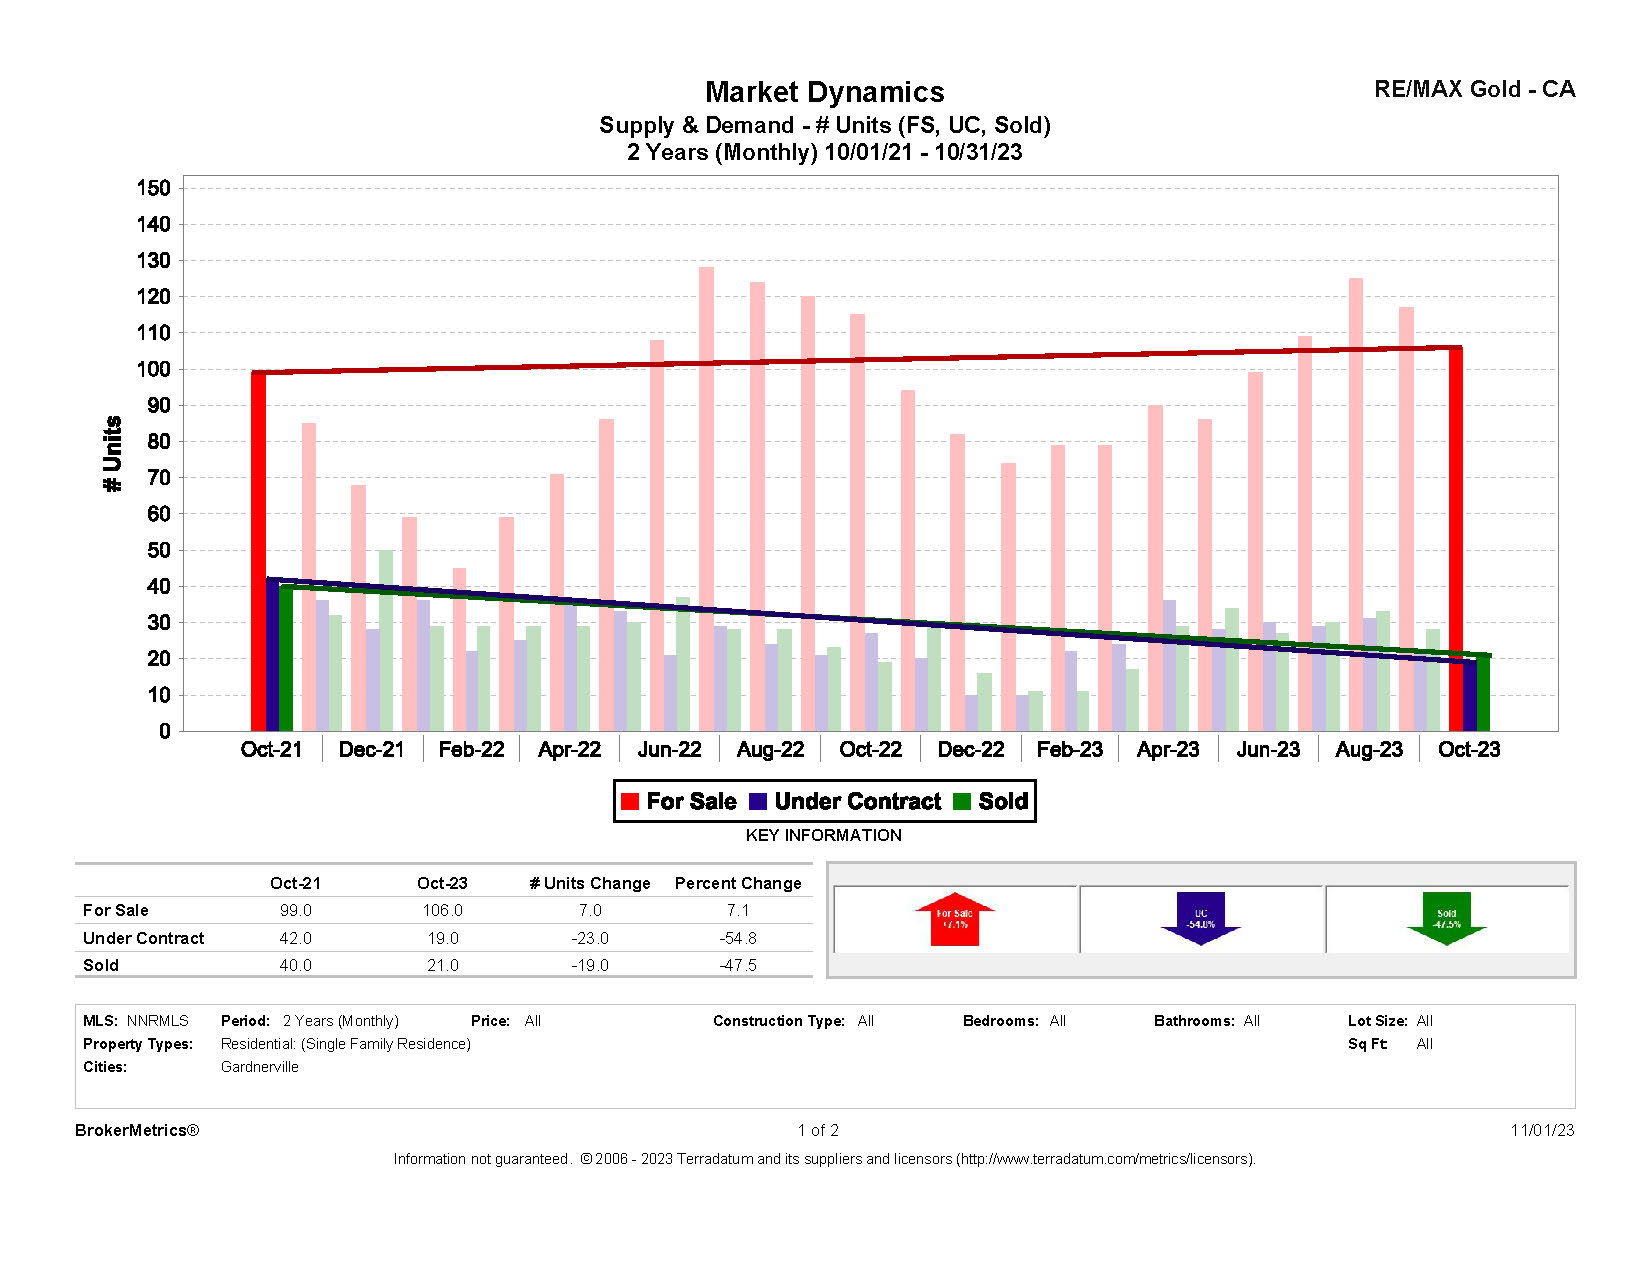
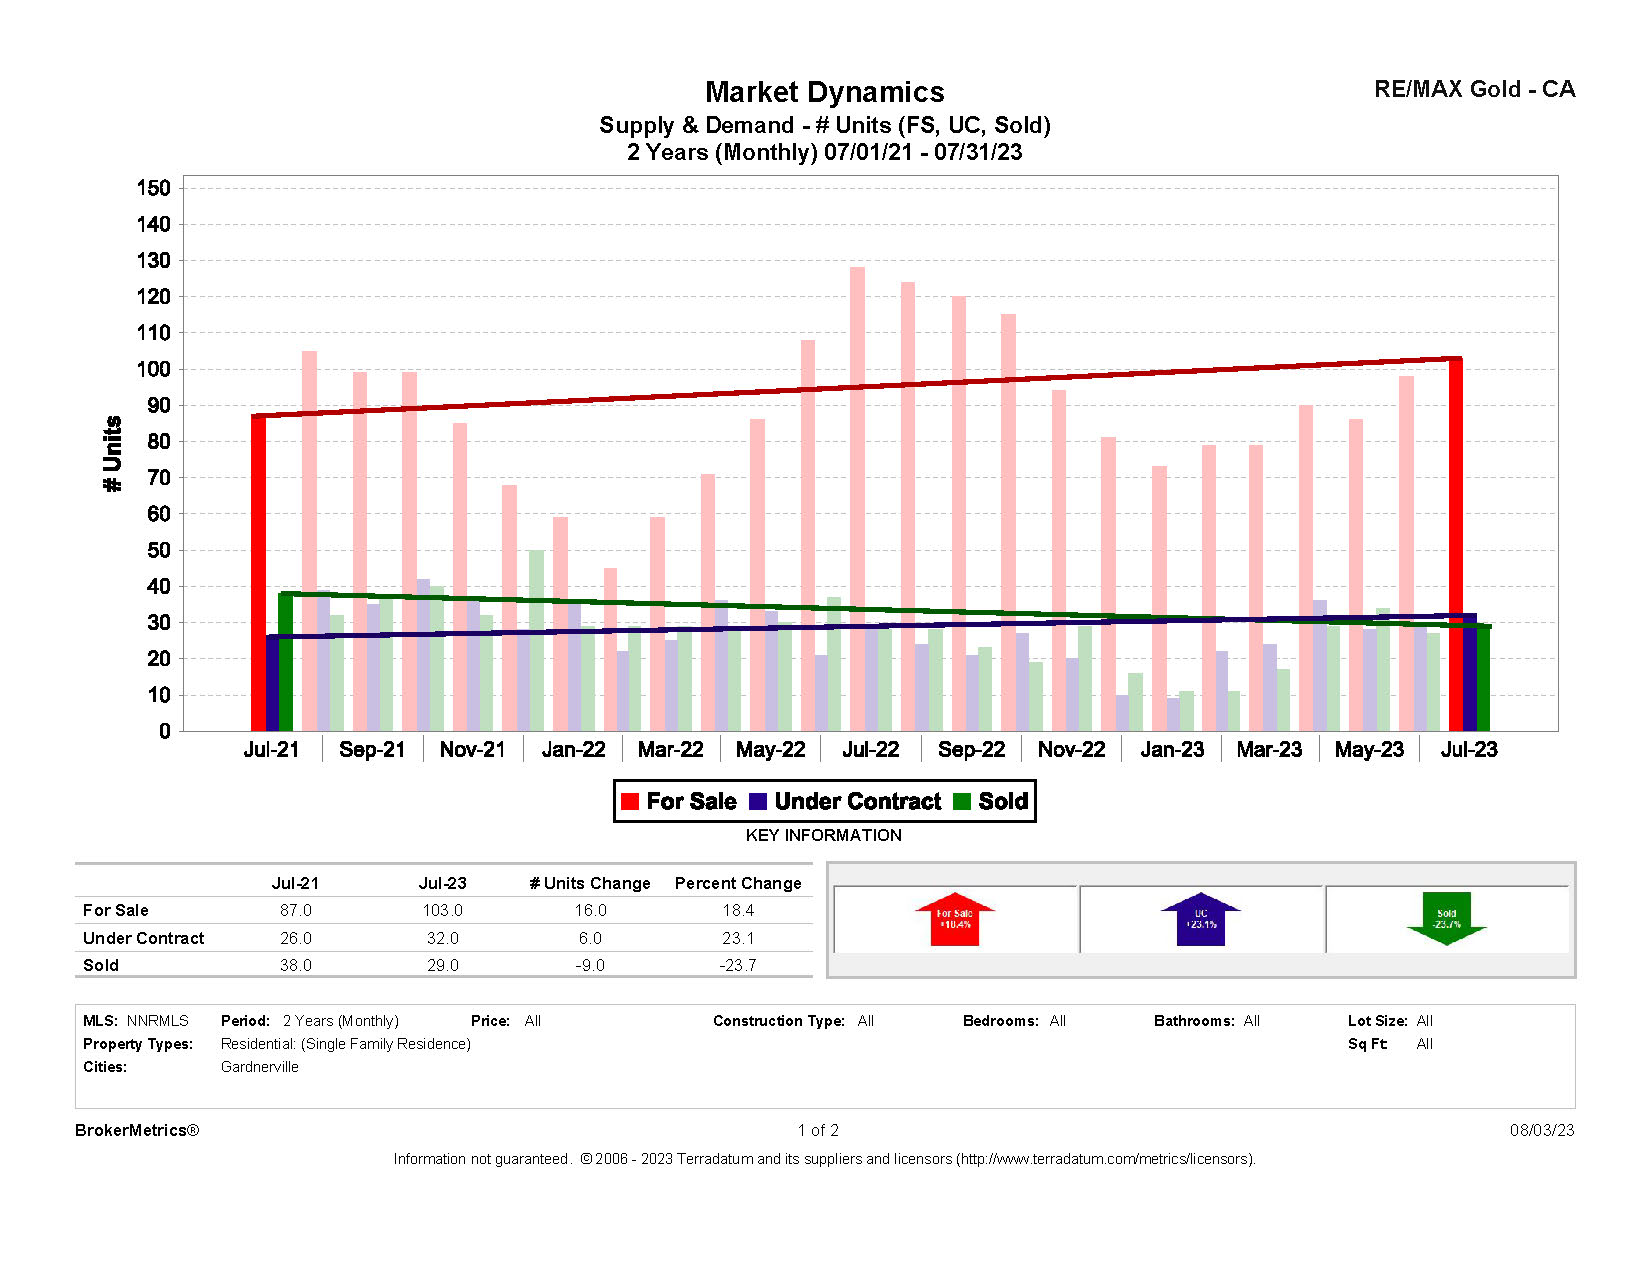
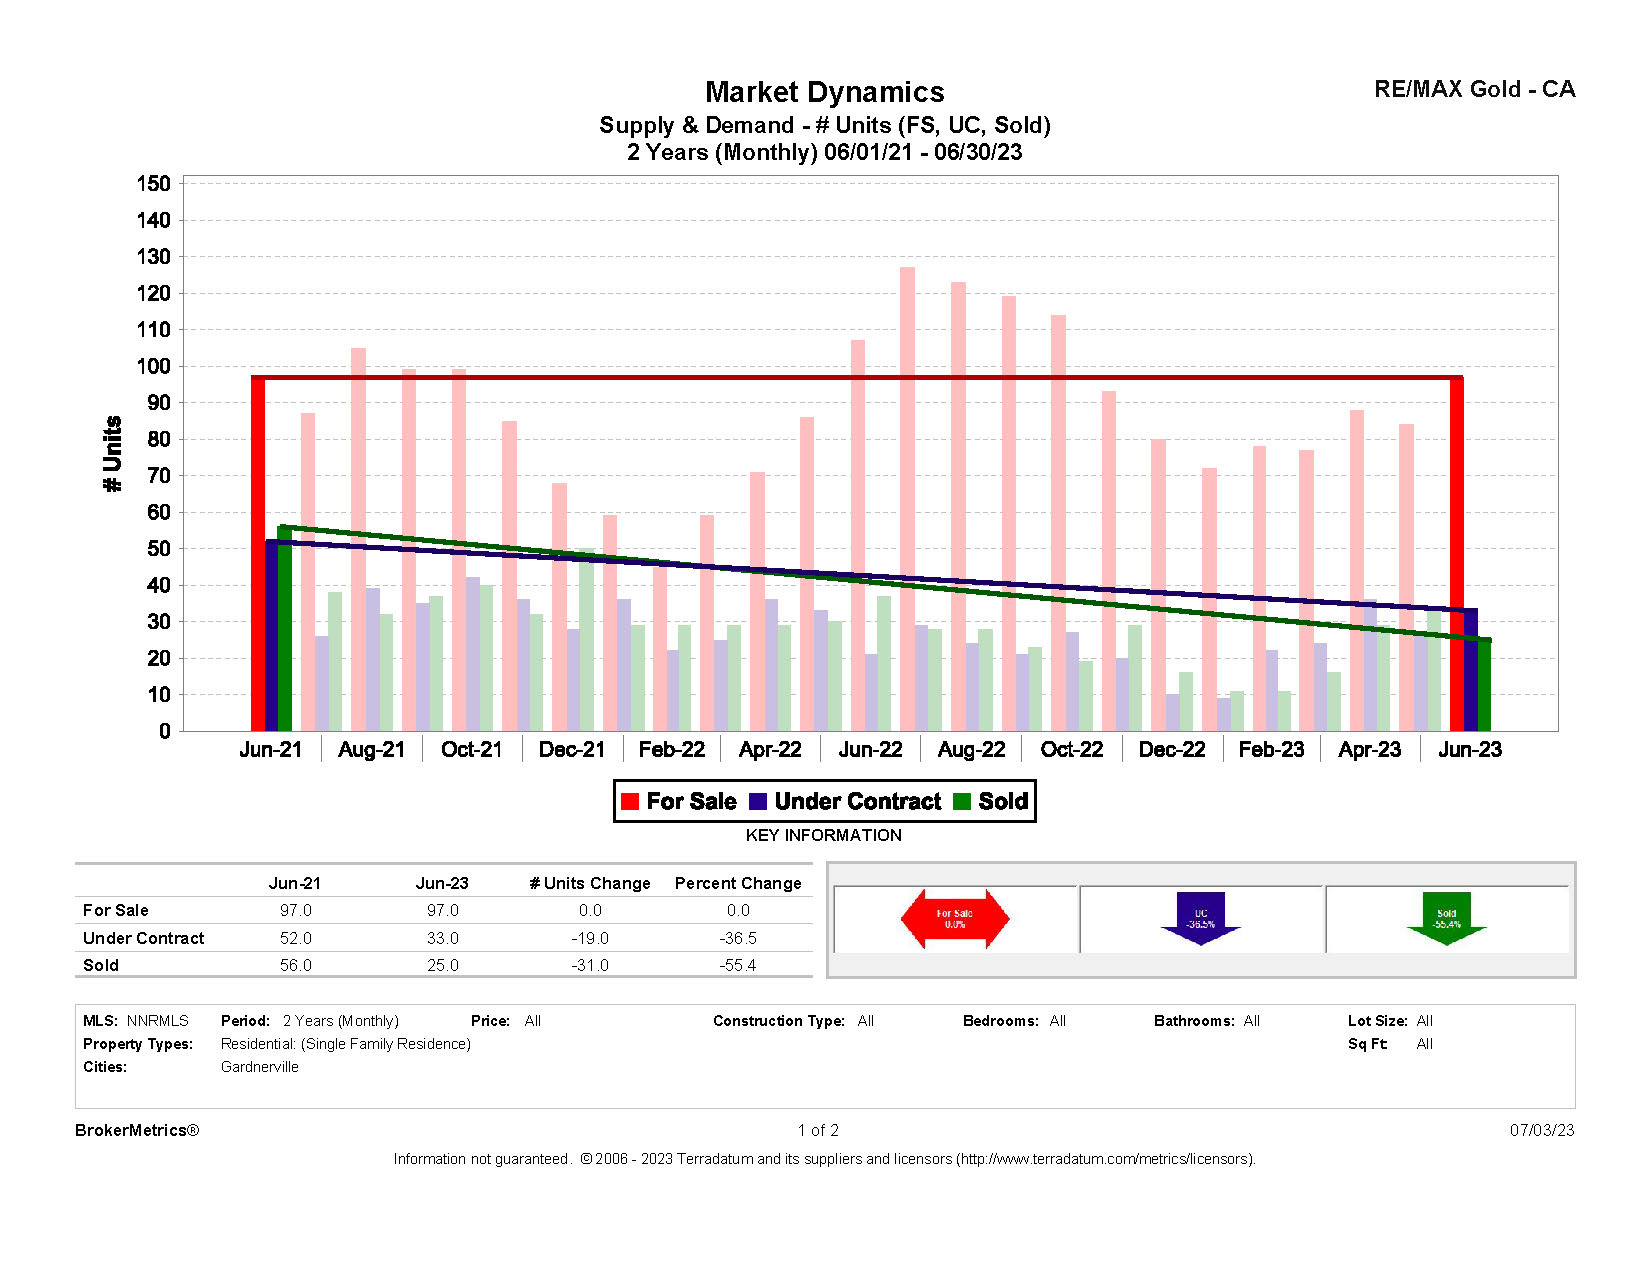
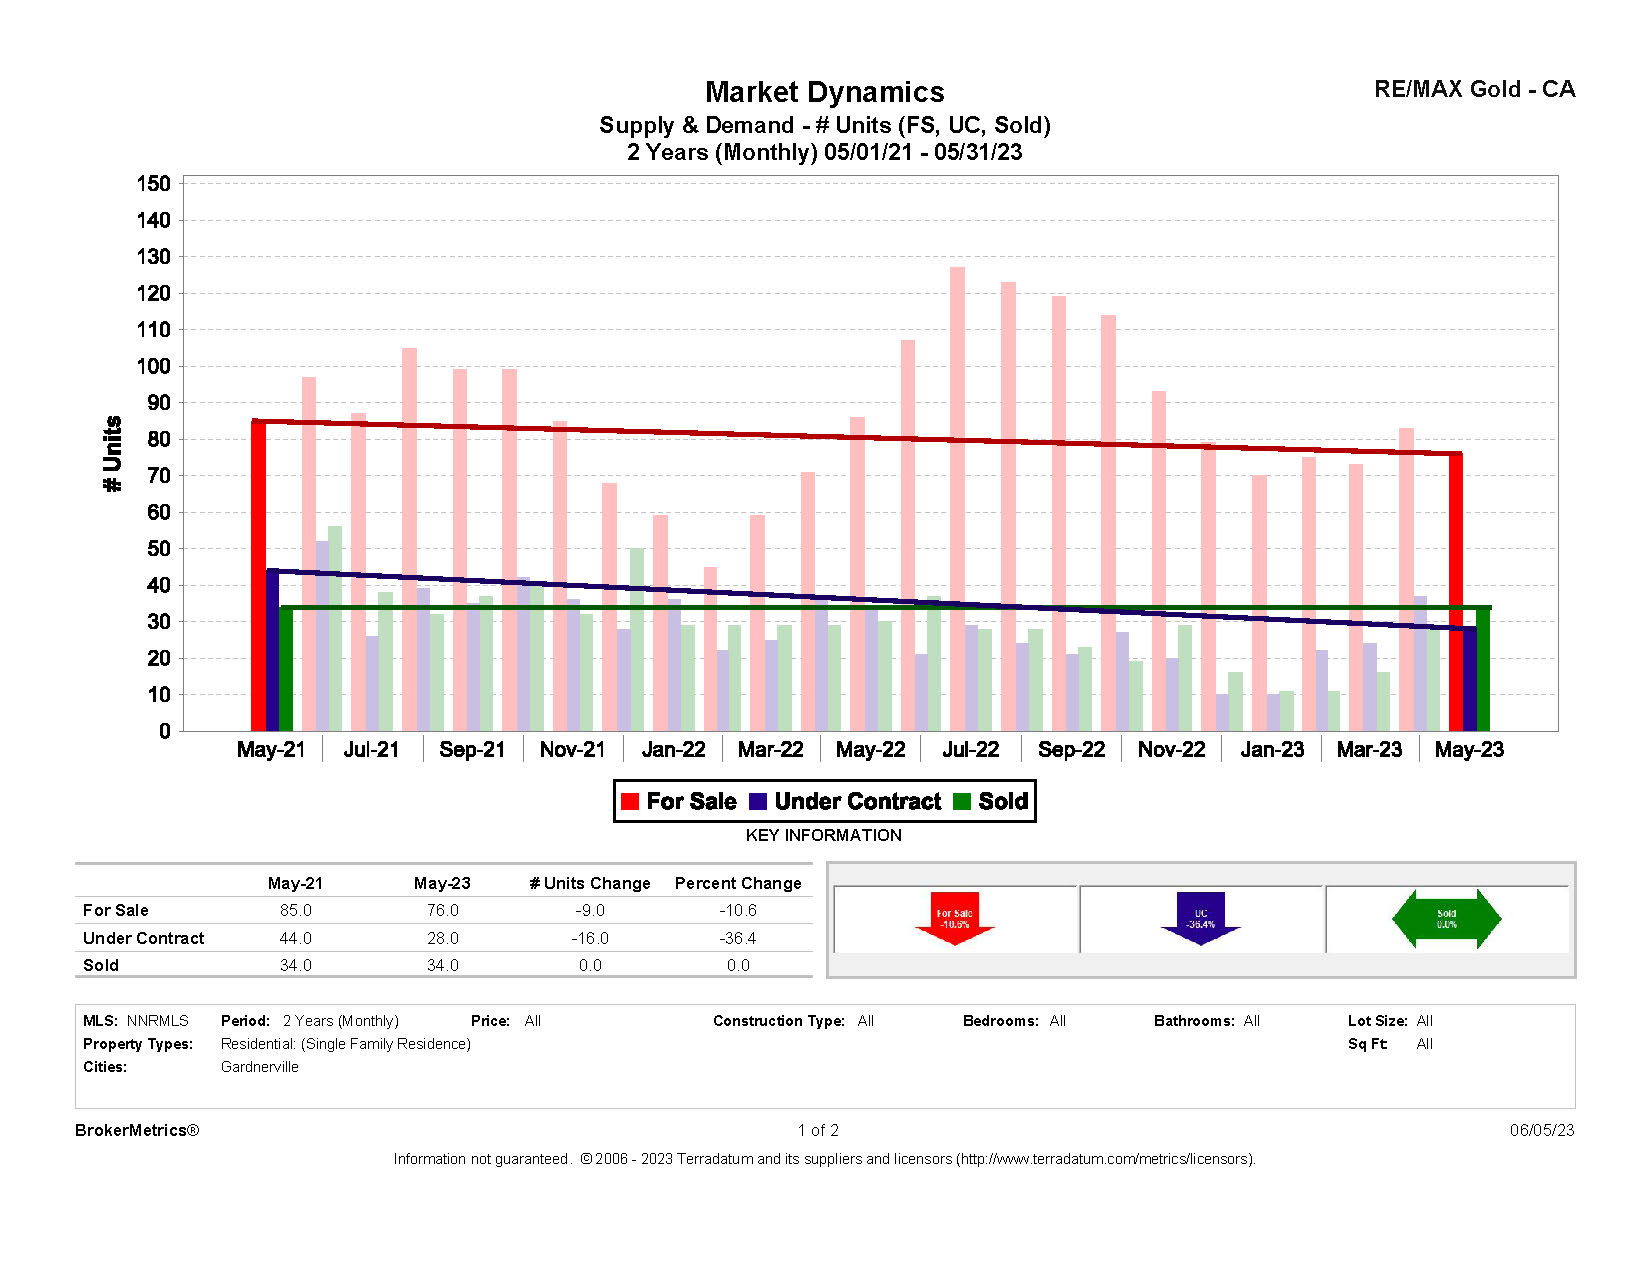
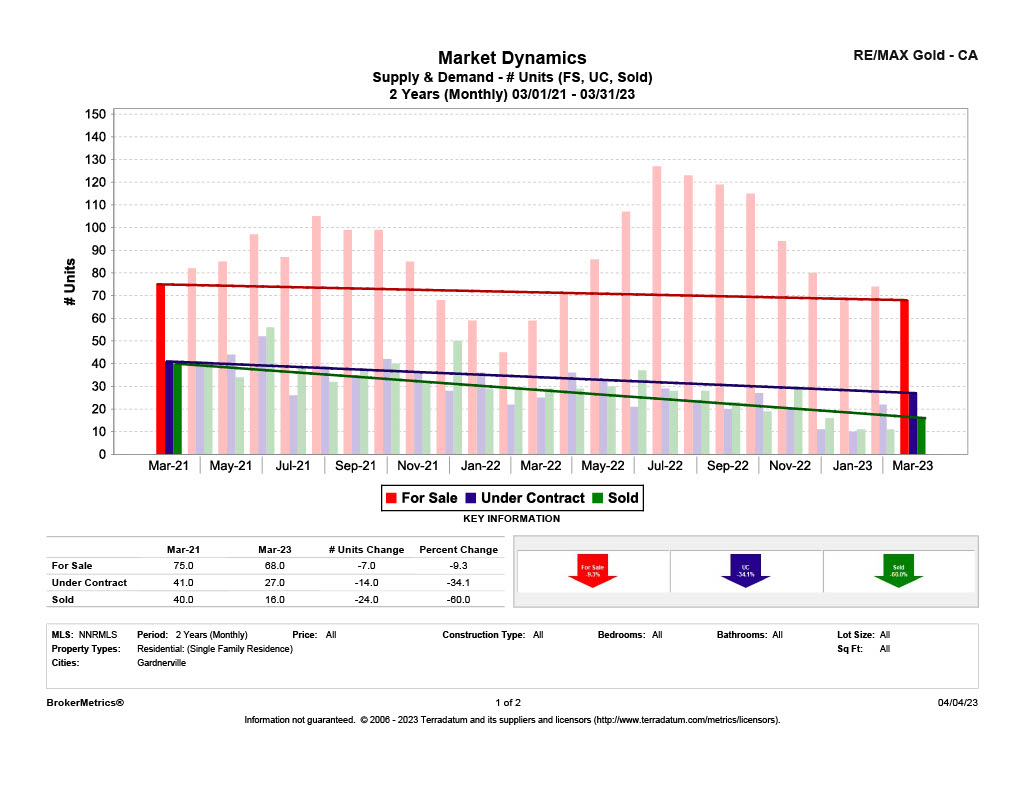
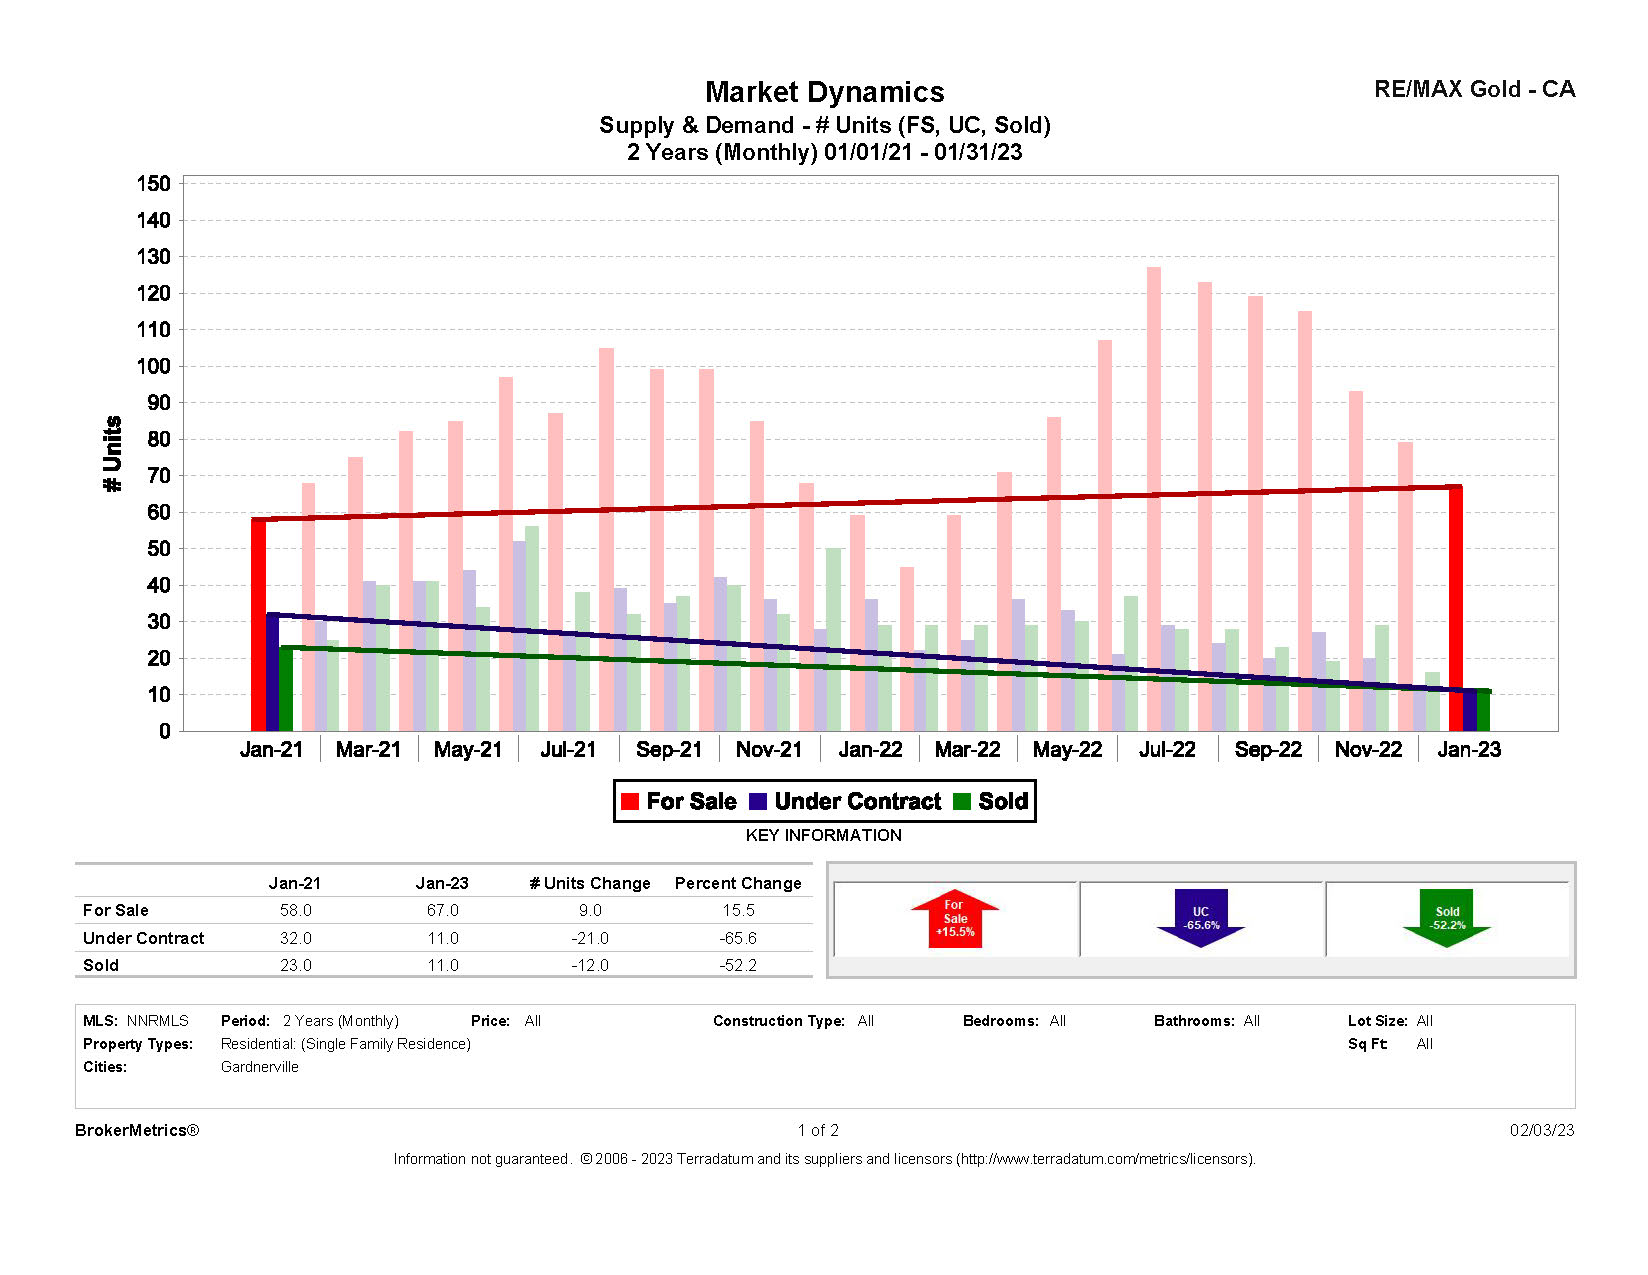
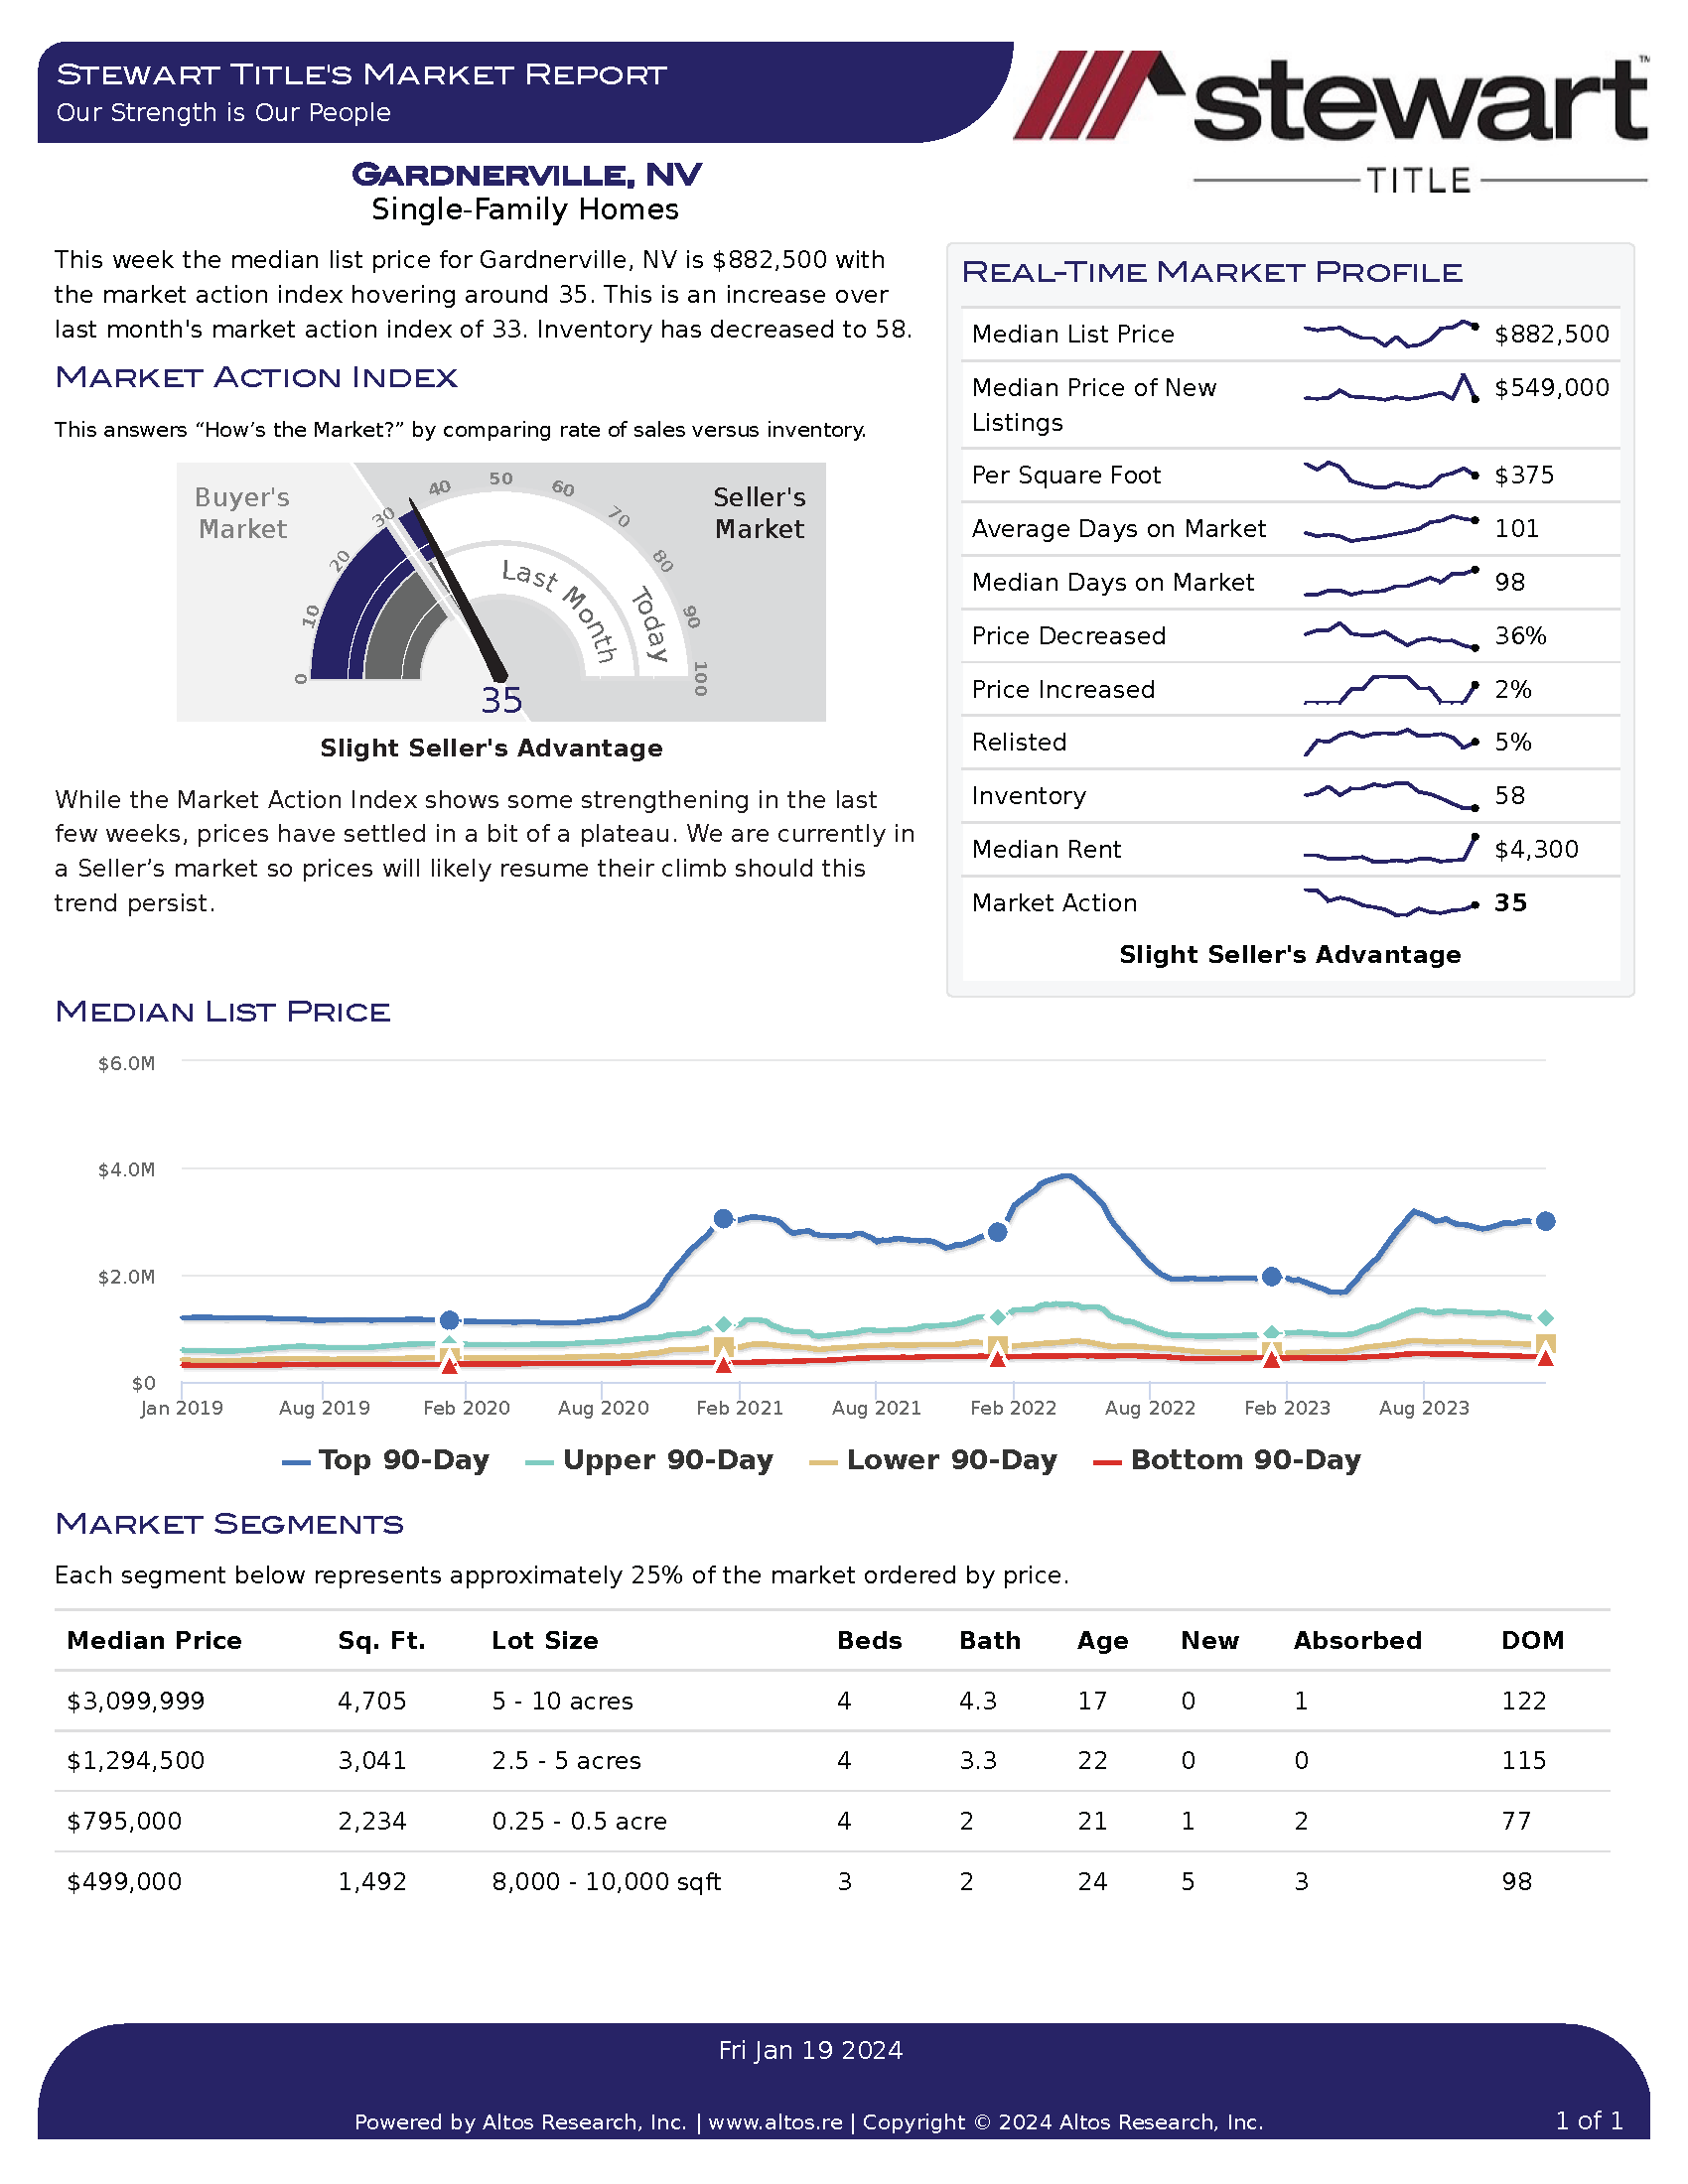
Gardnerville, NV Market Report:

Below is the latest real estate market report for the Gardnerville, NV area. The market action index is hovering around 35 which means the area is in a slight seller’s advantage.
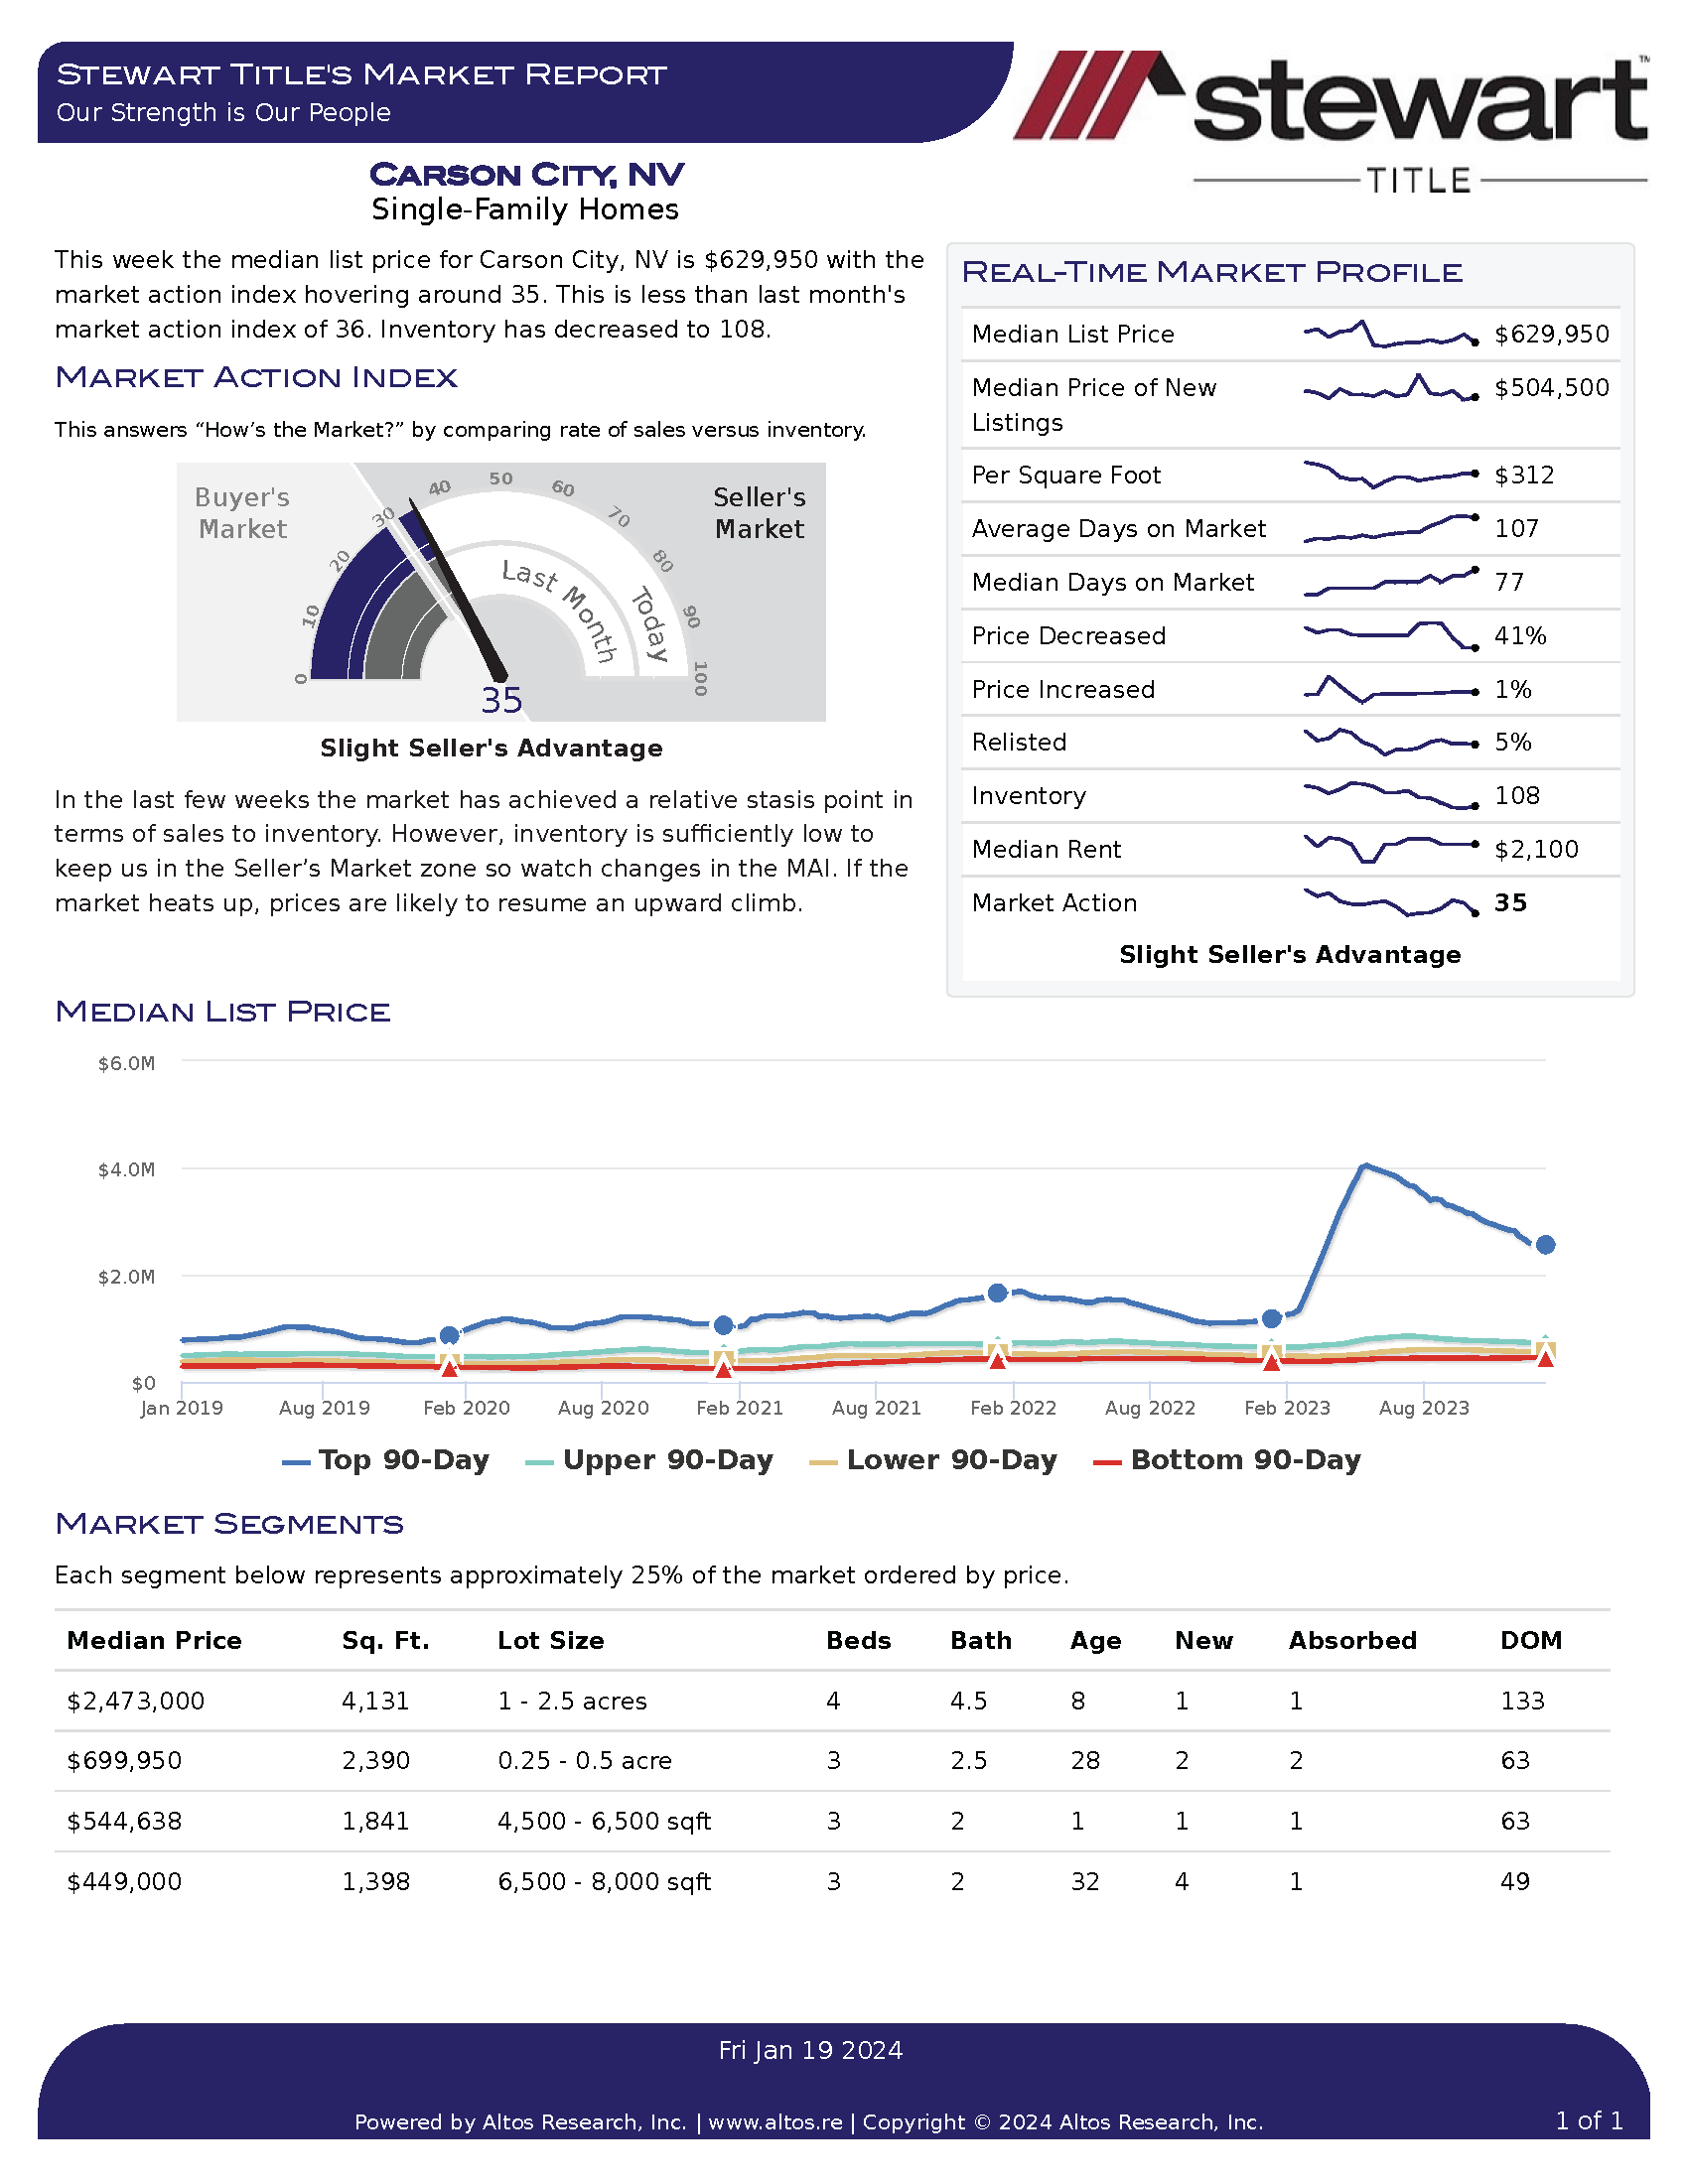
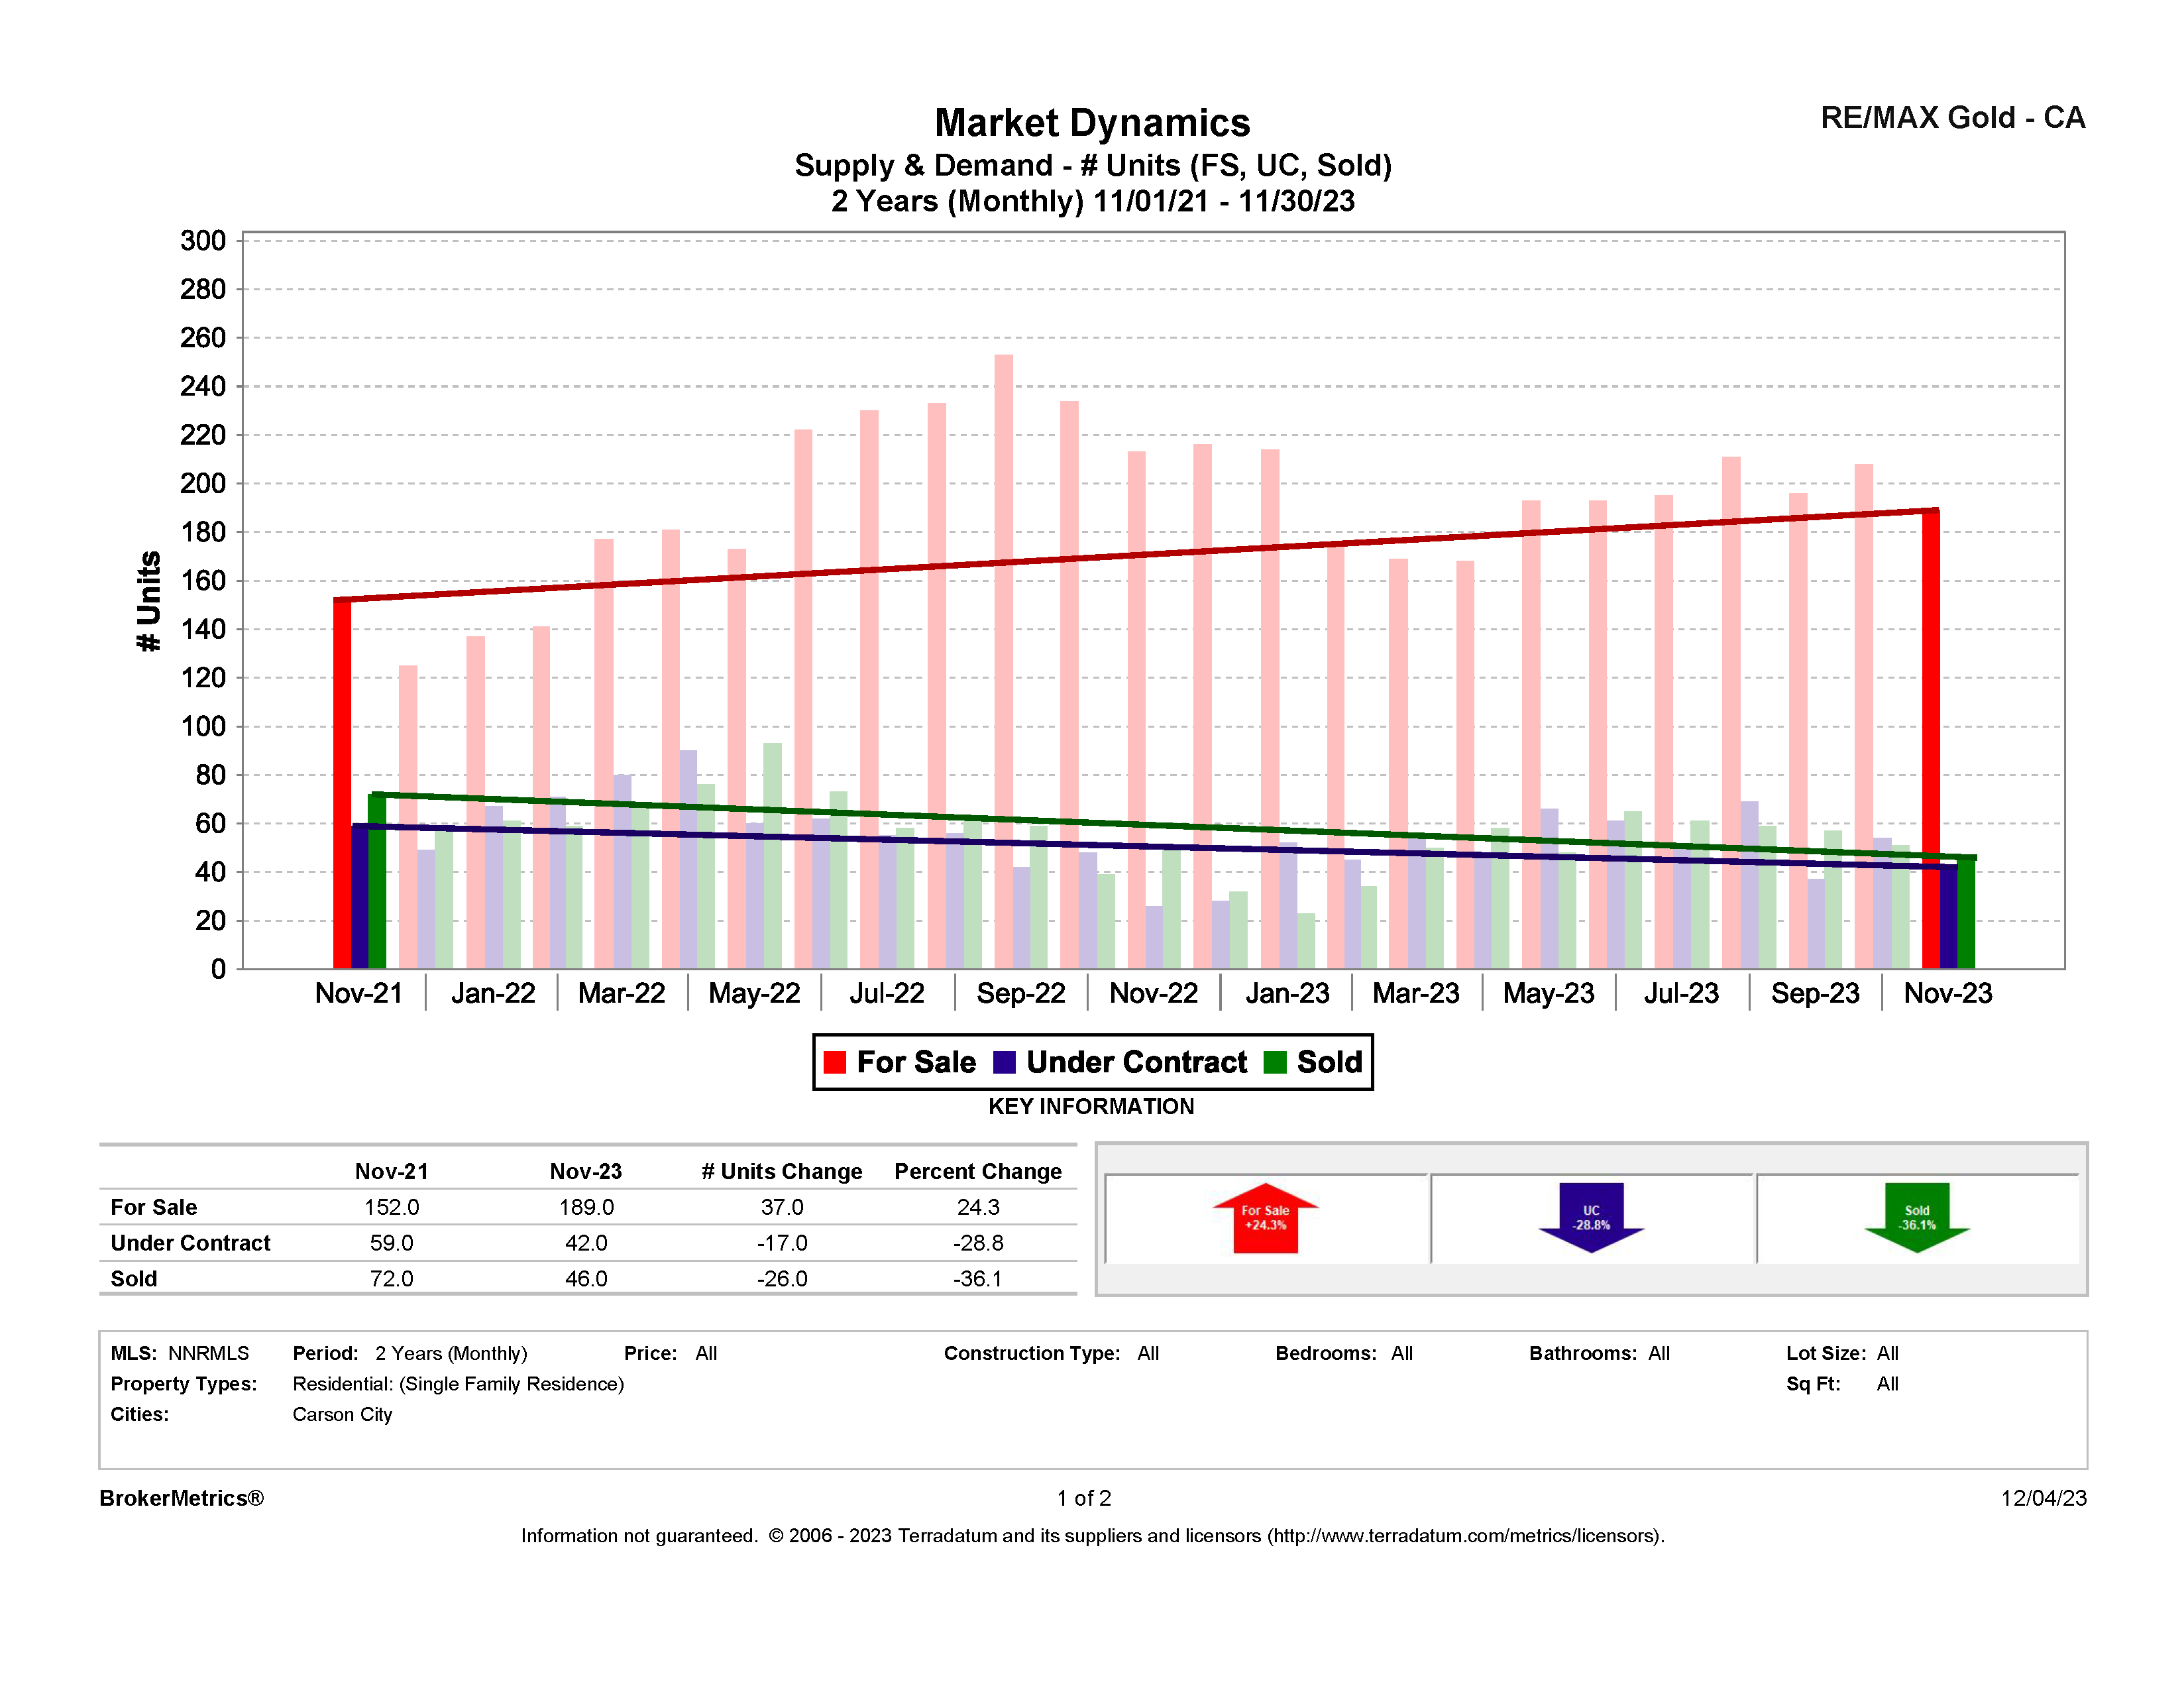
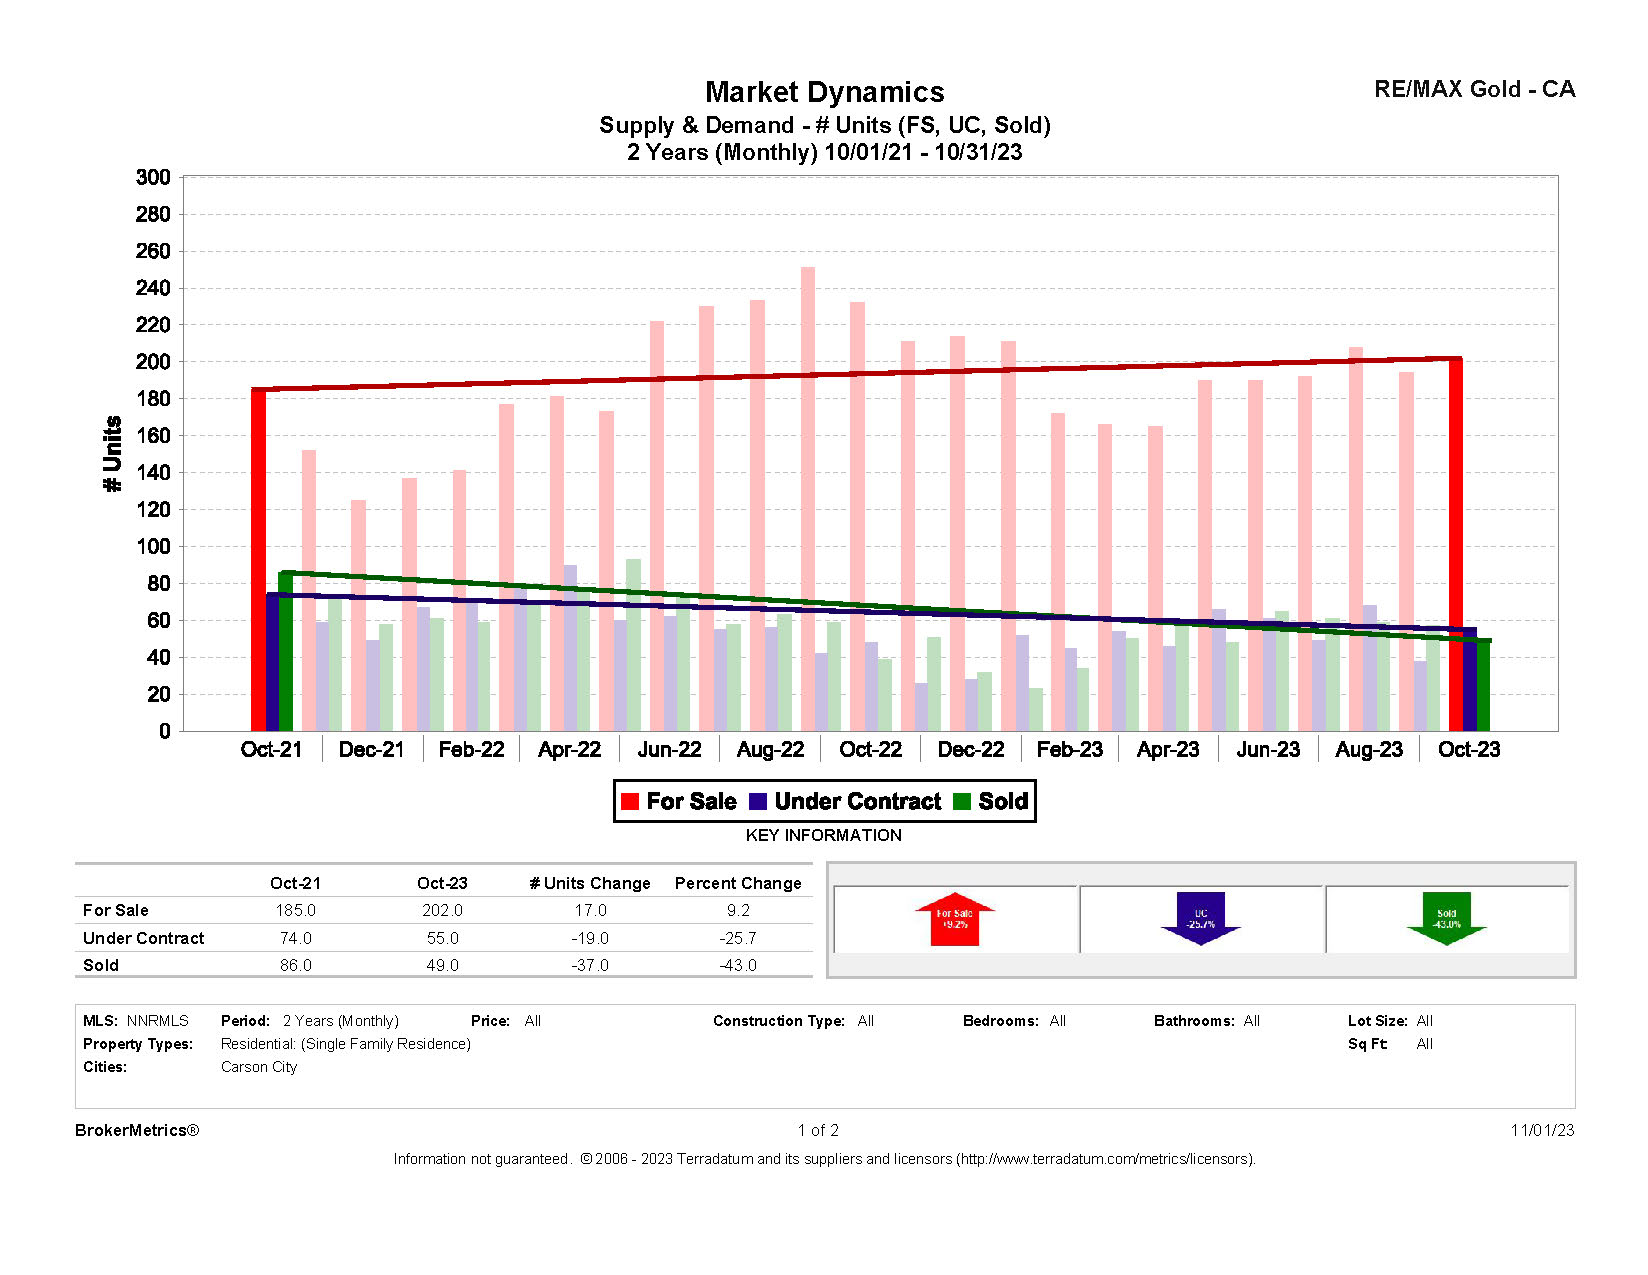
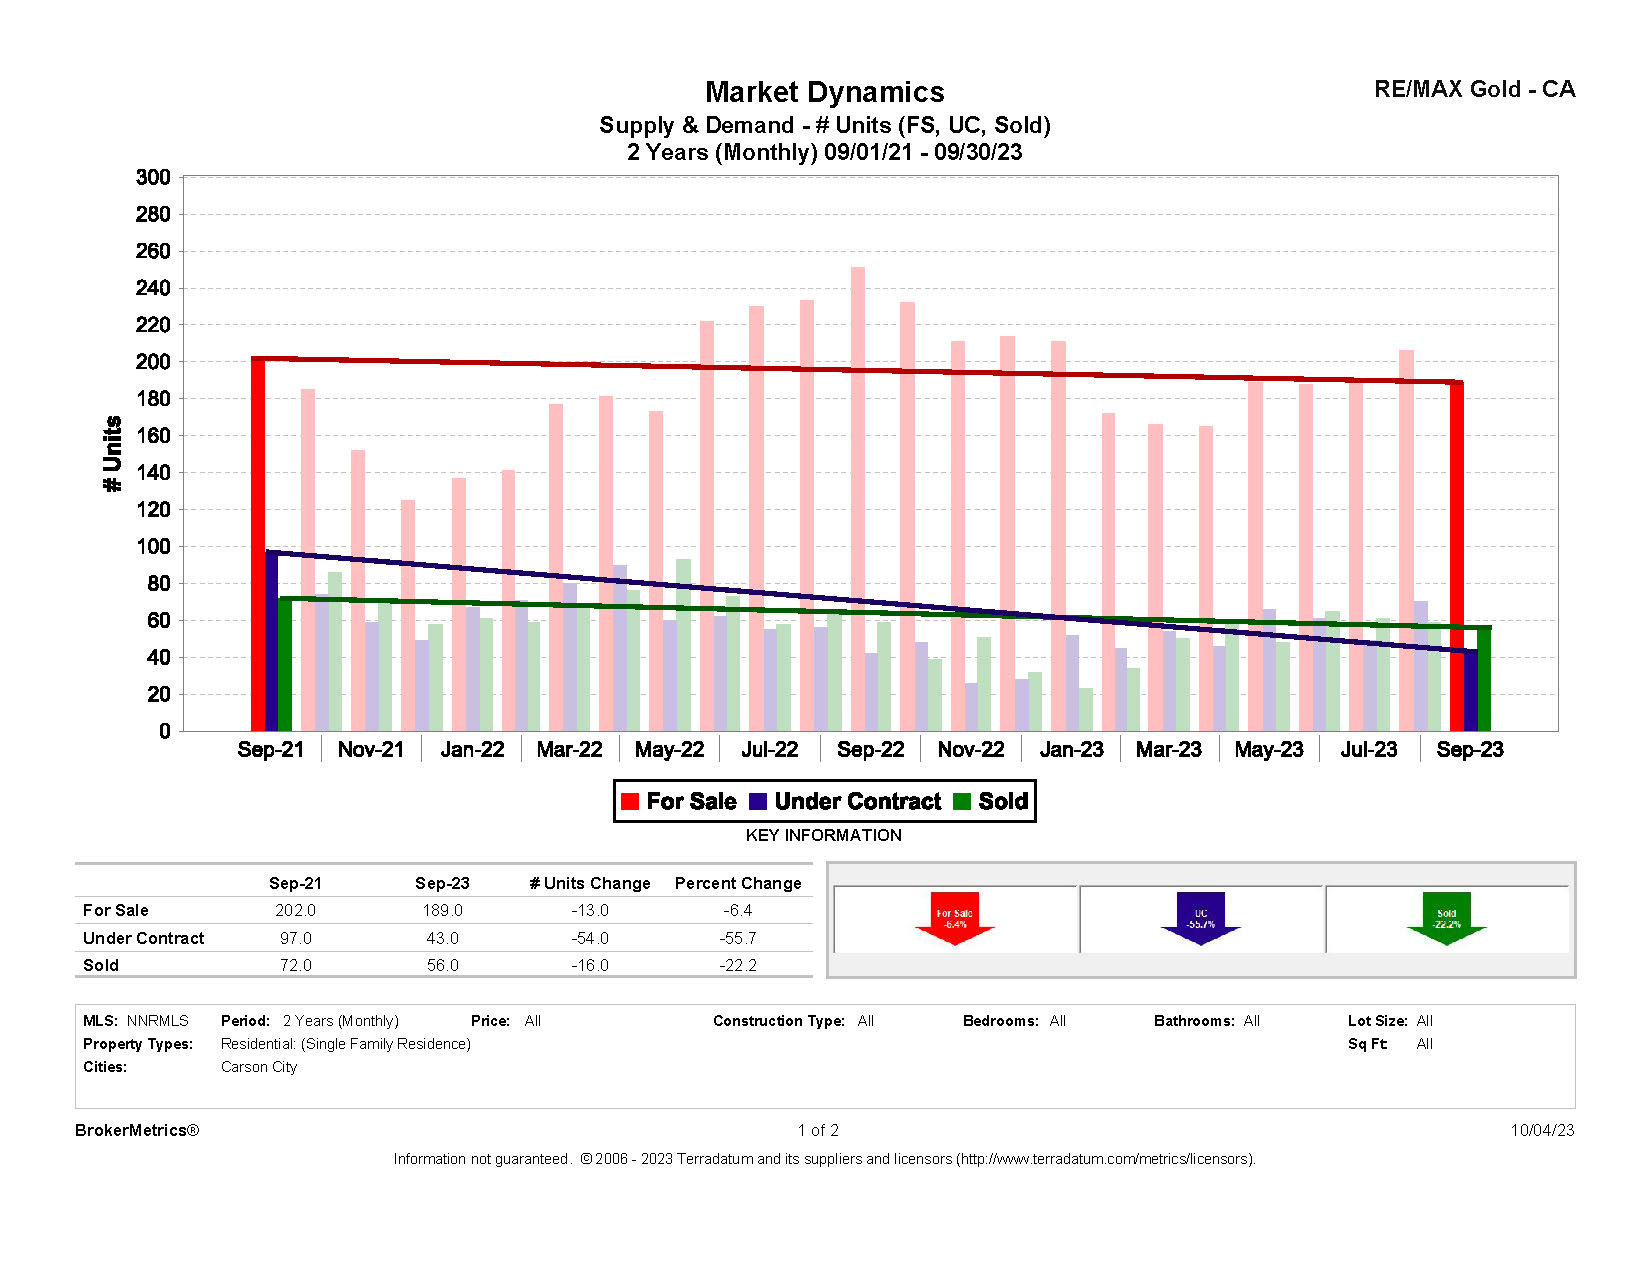
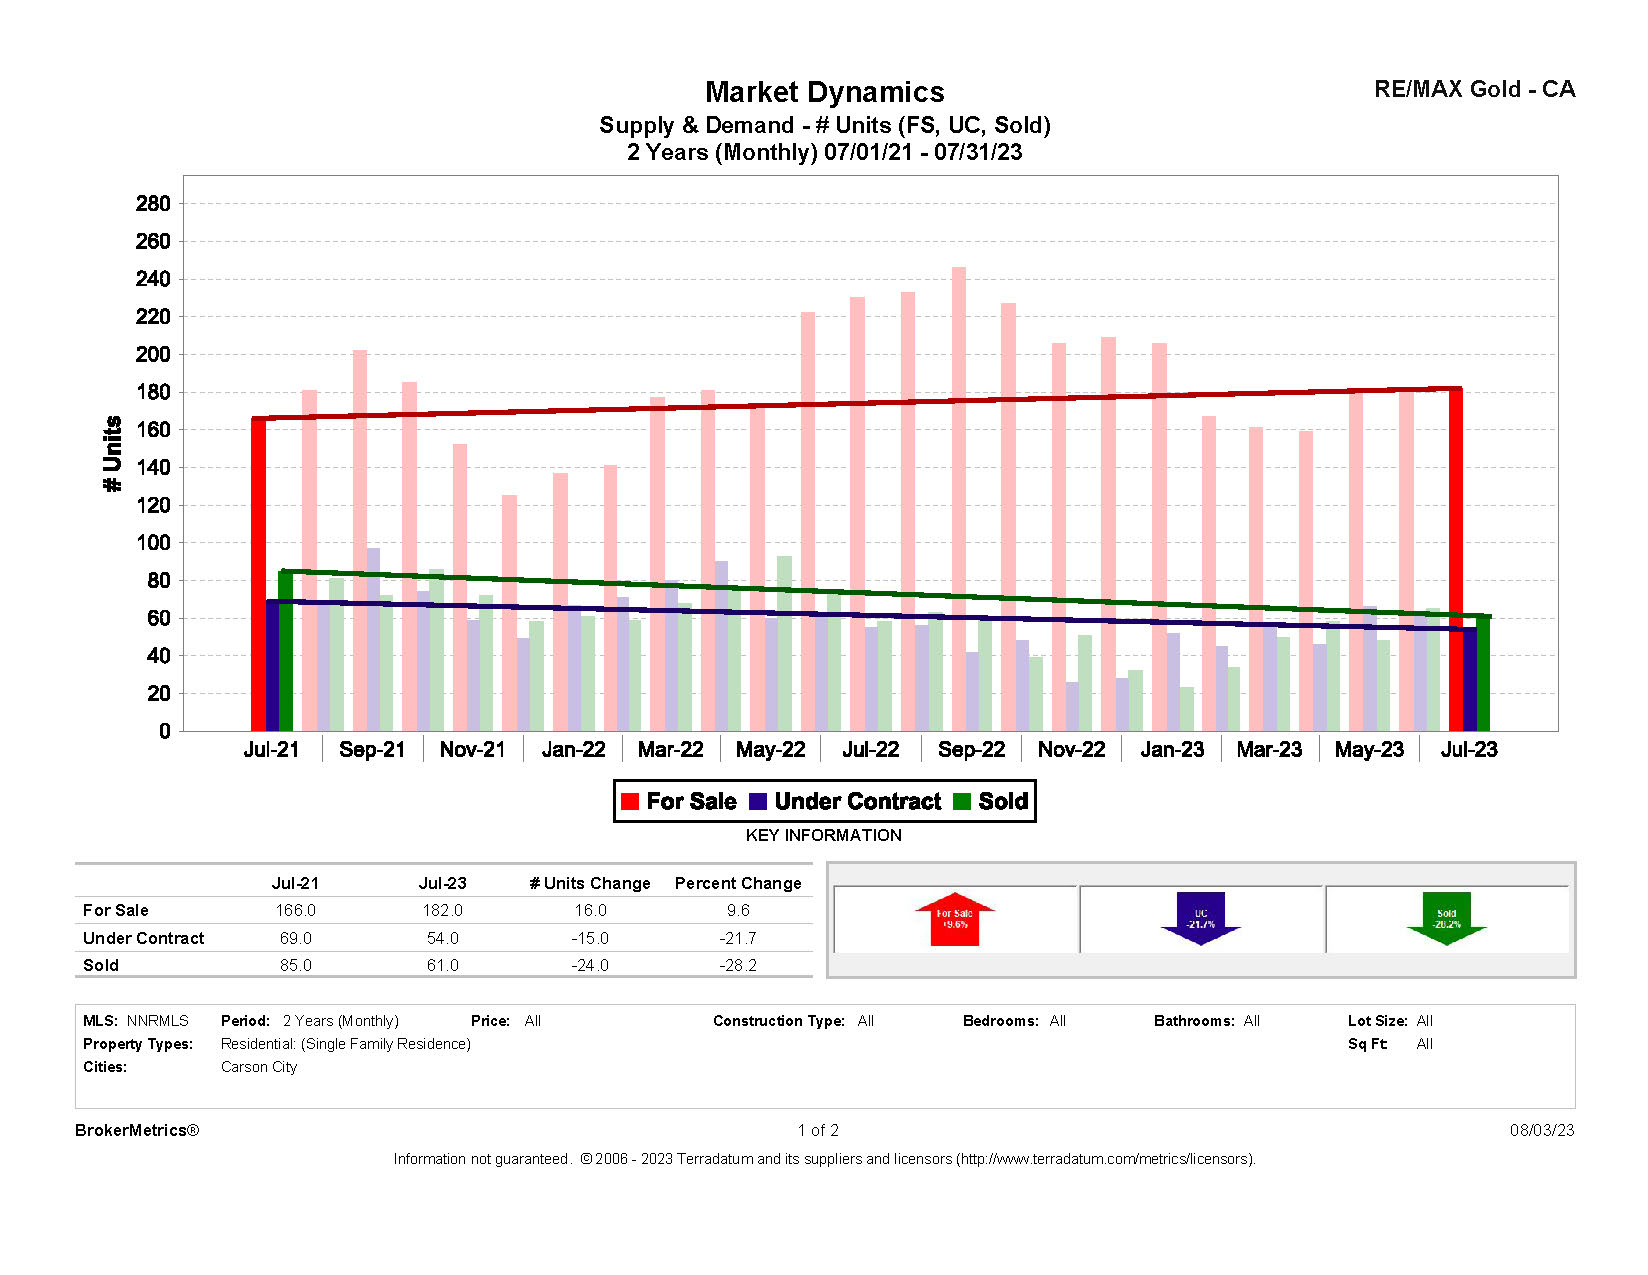
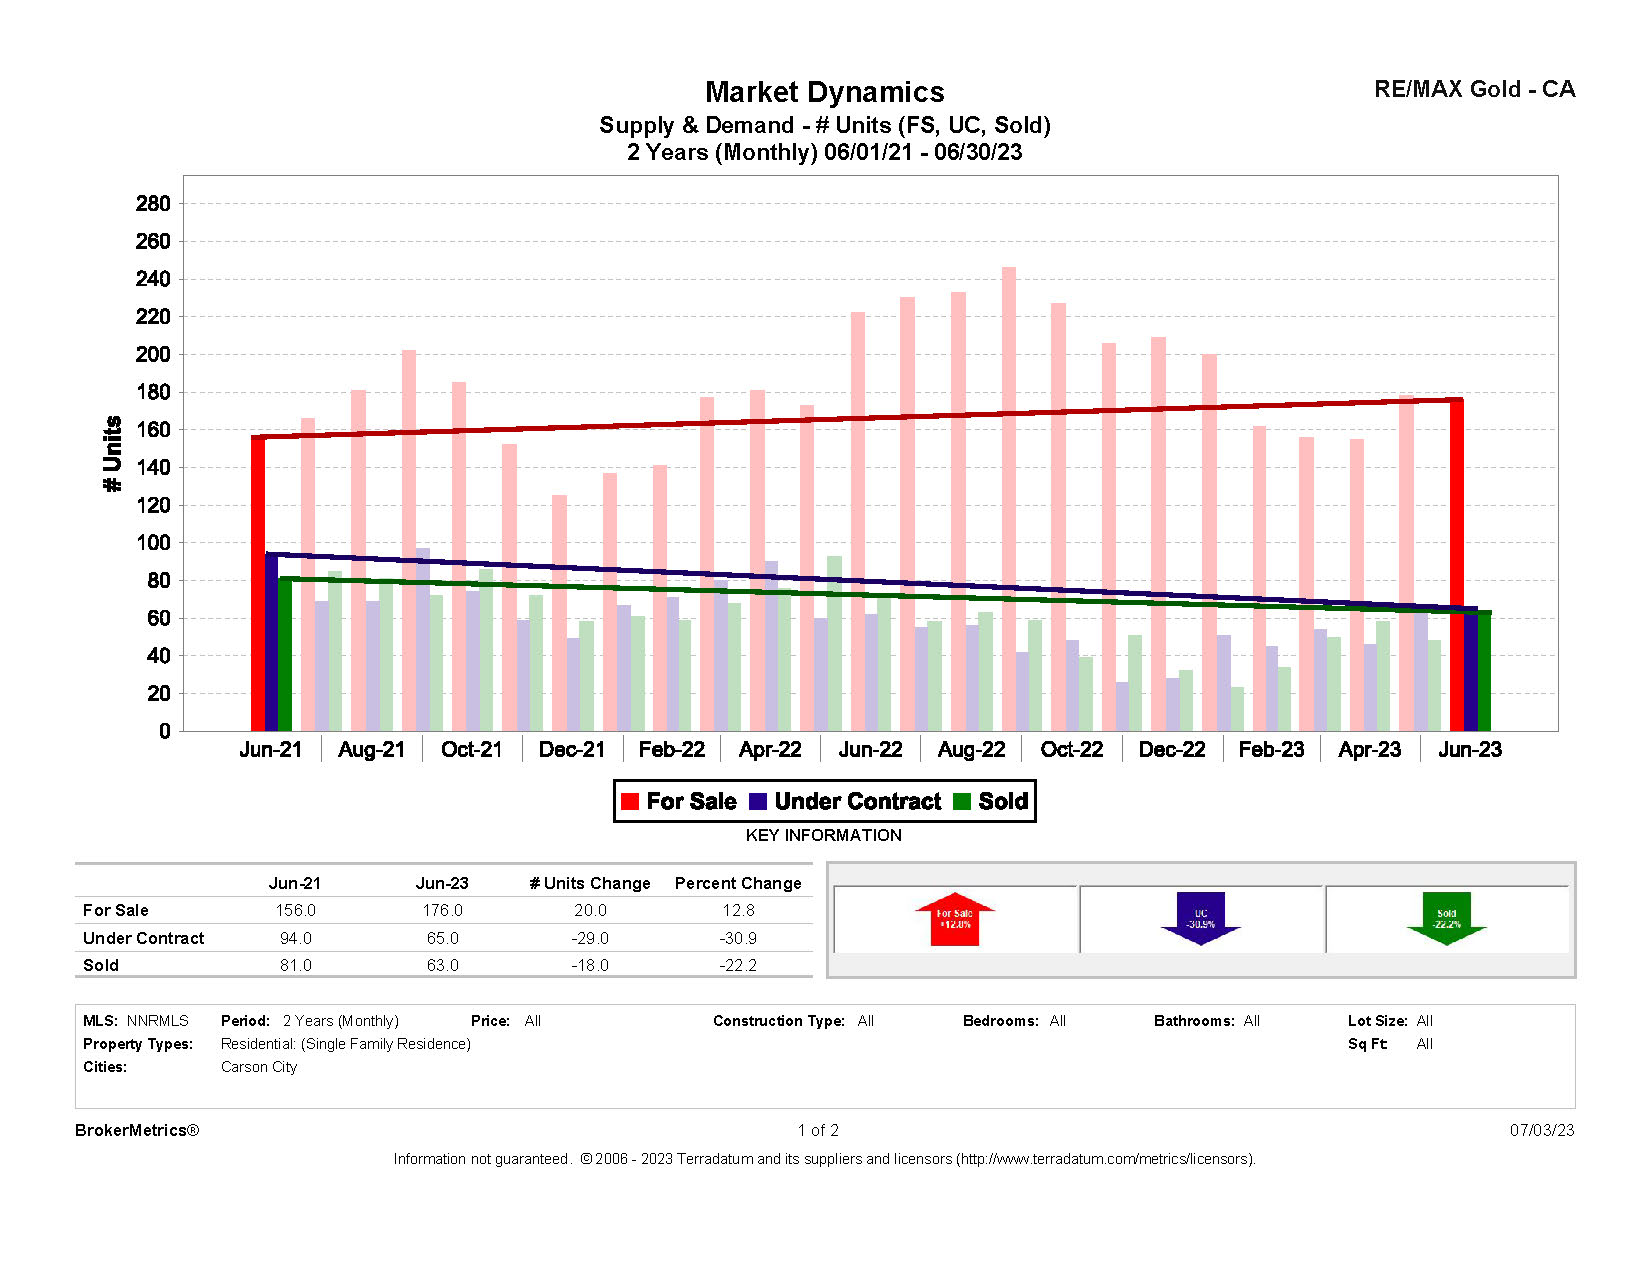
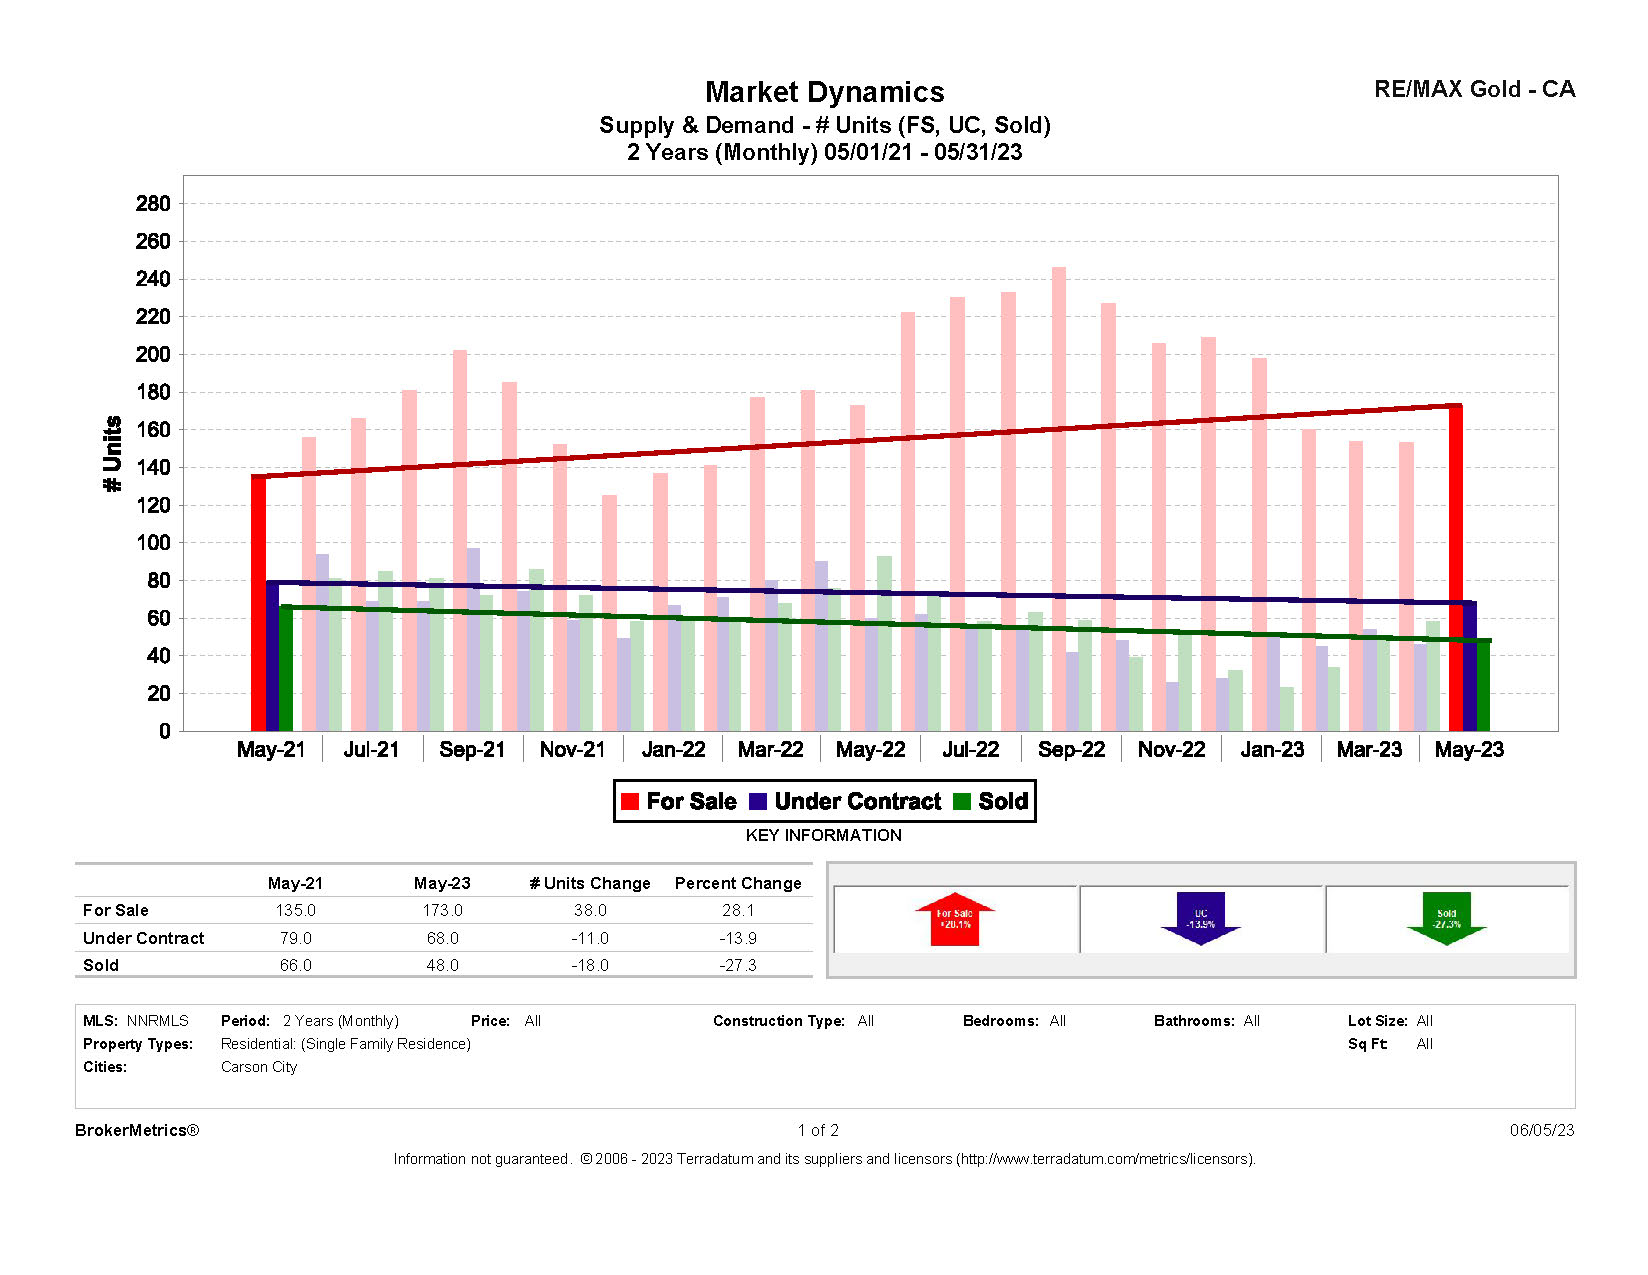
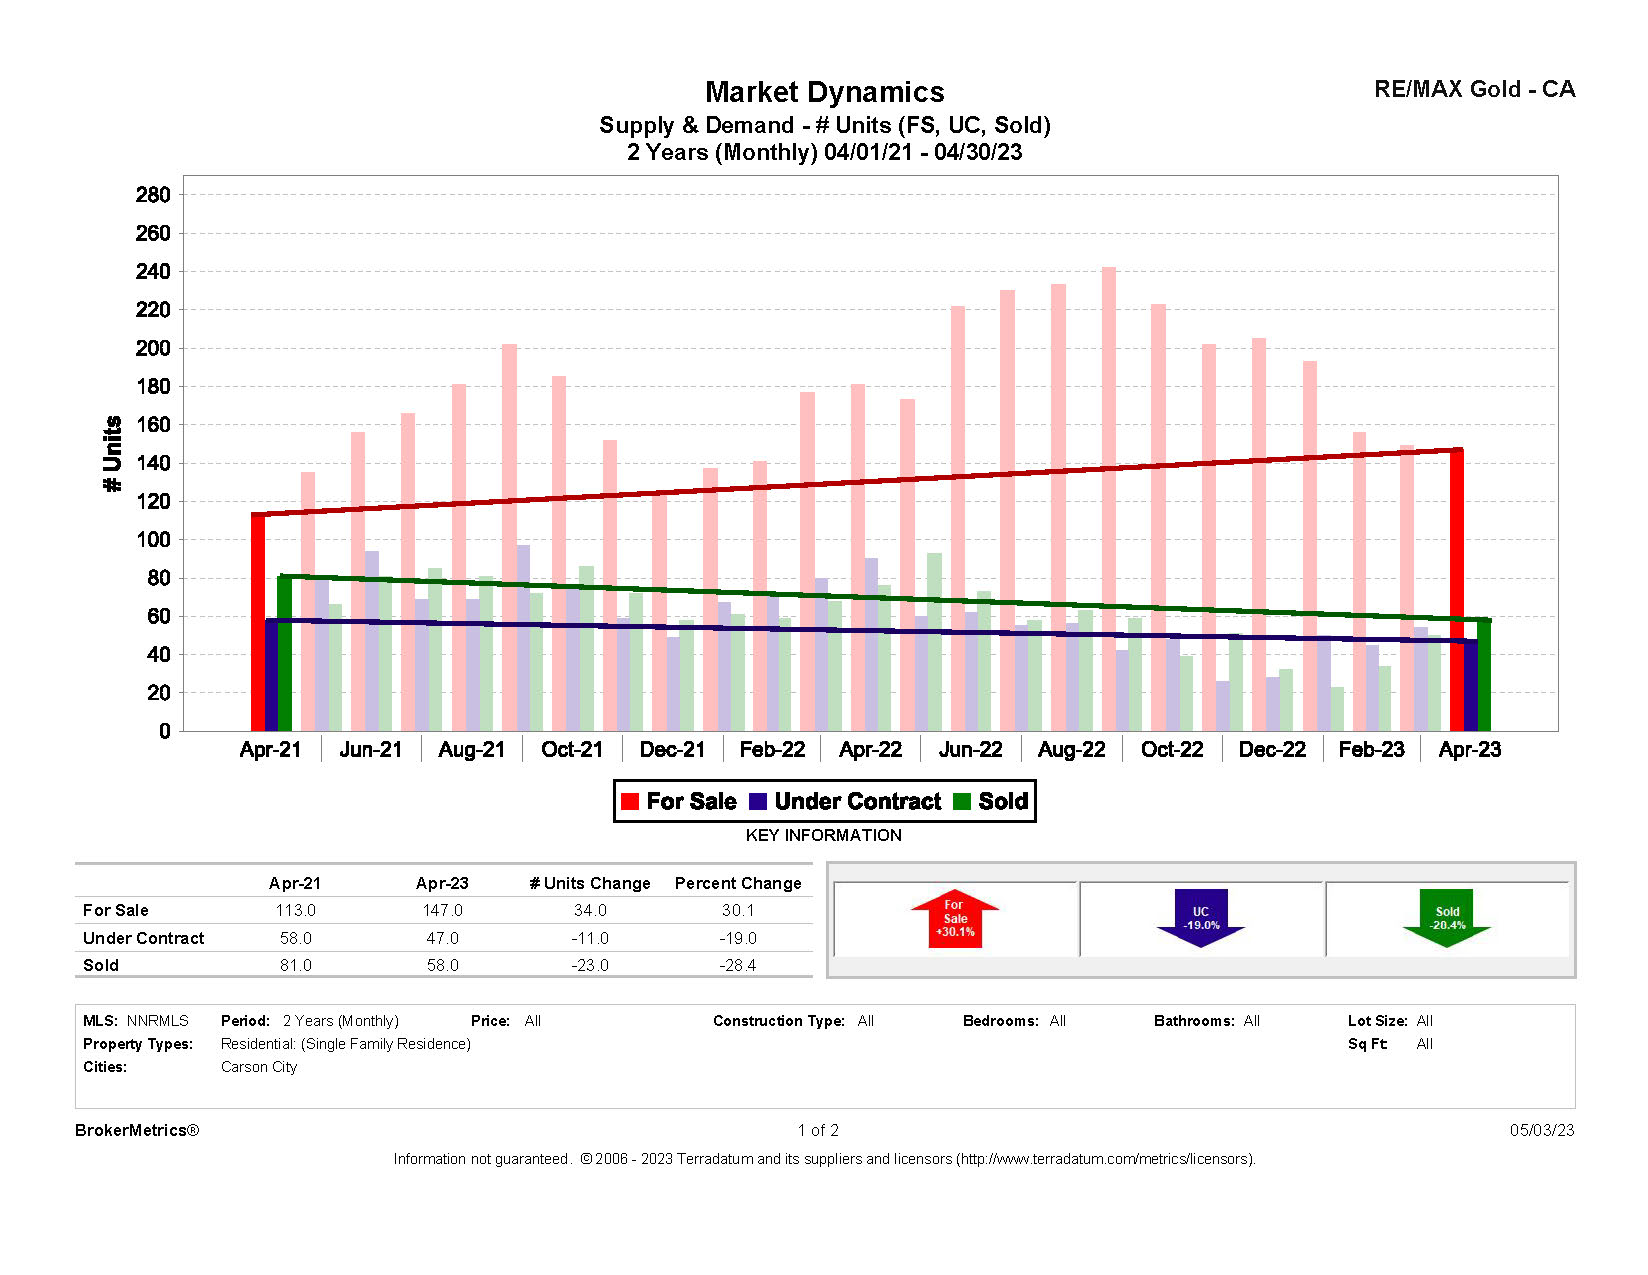
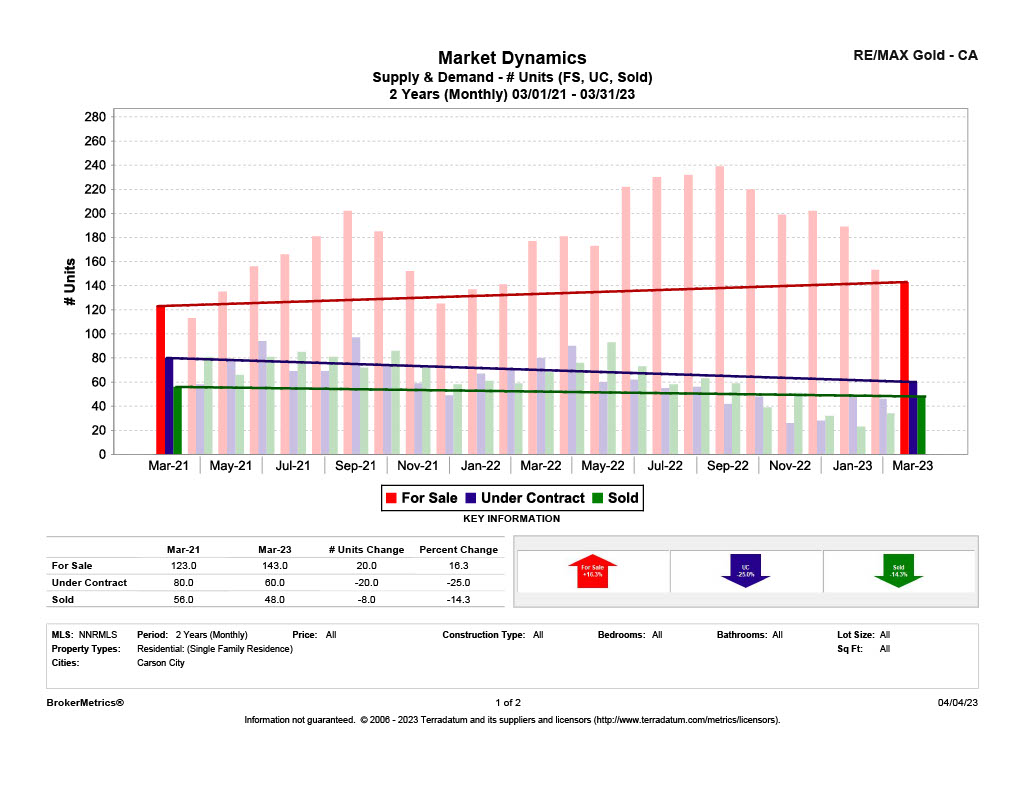
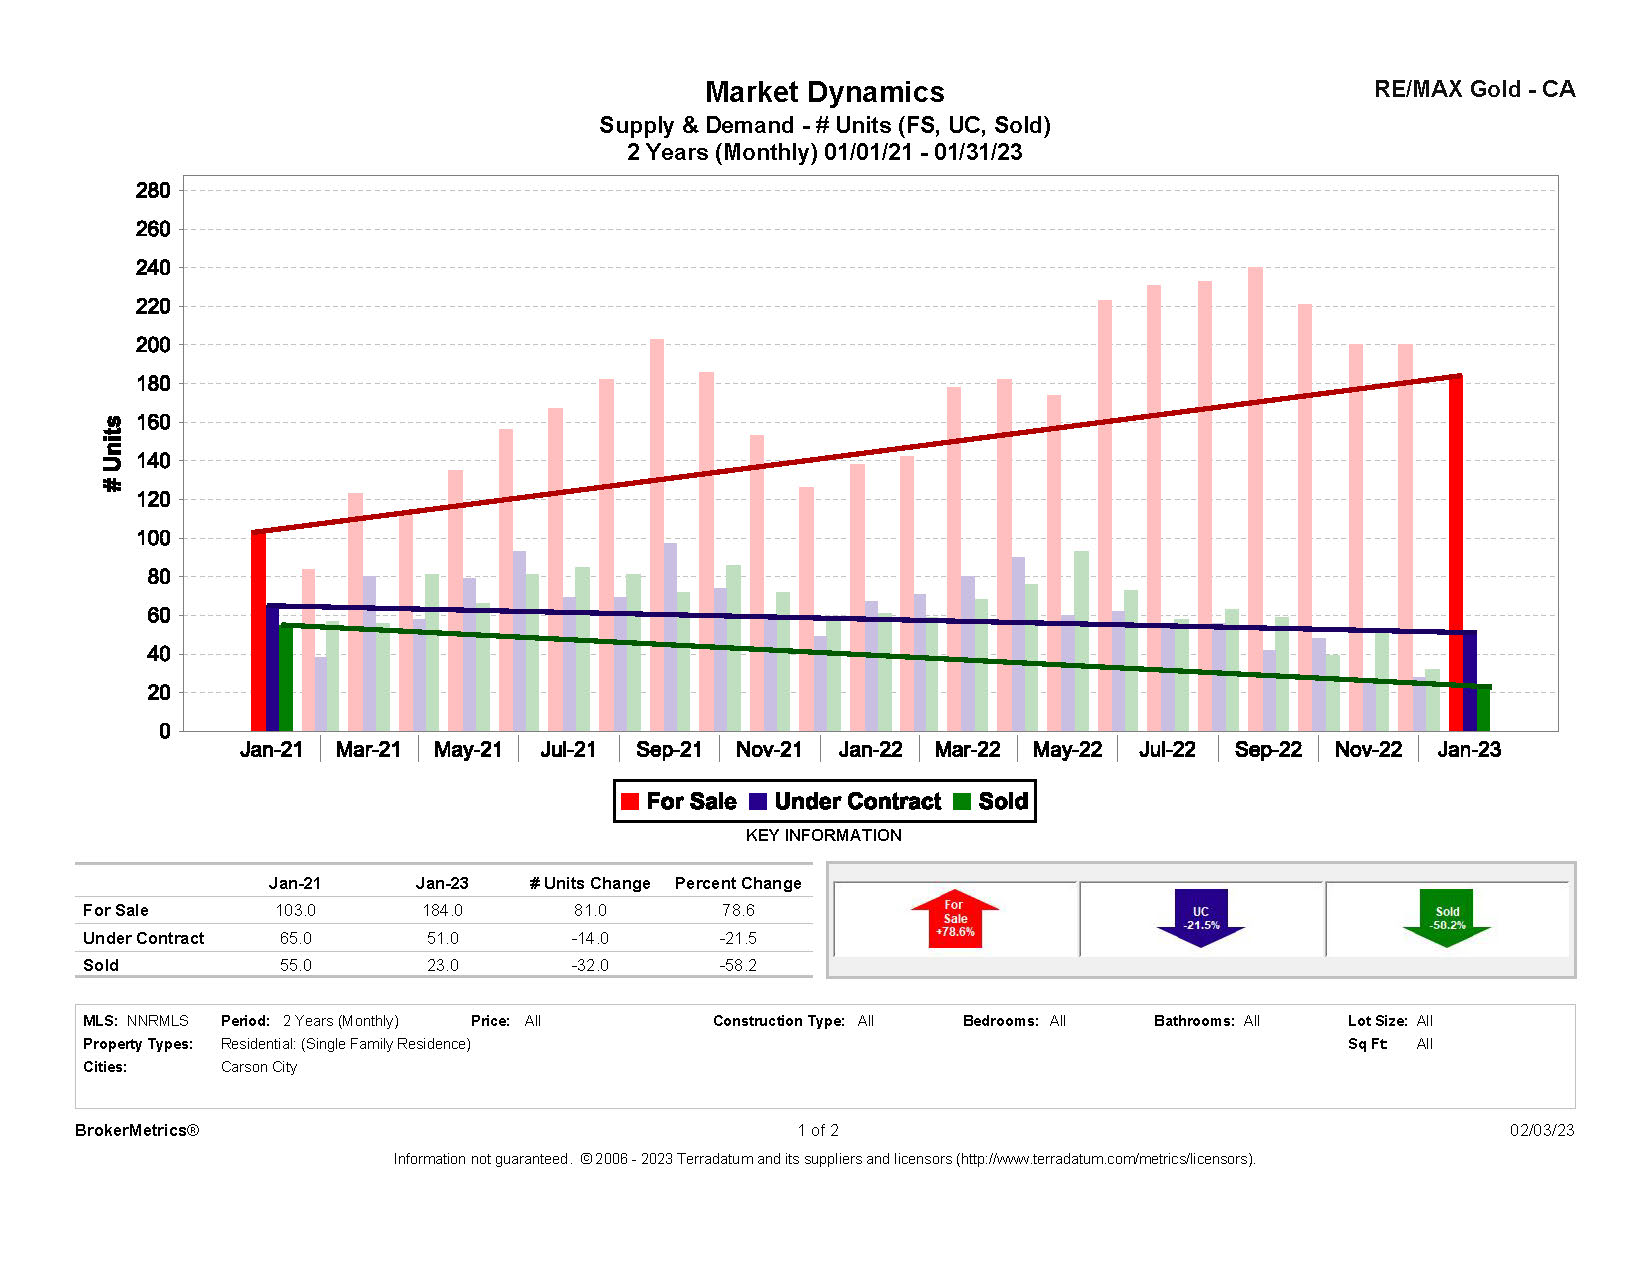
Real estate market report for Gardnerville, Nevada.

Carson City, NV:

Below is the latest report for the Carson City, NV area. The market action index is hovering around 35 which means this area is in a slight seller’s advantage.

Real estate market report for Carson City, Nevada.

November 2023 Residential Stats

December 8, 2023 by admin

The November 2023 residential stats are now available. So let’s take a look at some of the key features. Below you will find snapshots showing the supply and demand for the Gardnerville, Minden, and Carson City markets. As you can see, the supply of available homes for sale is up 23.5% for Gardnerville compared to 2 years ago, up 15.4% for Minden, and it is up 24.3% for Carson City.

For additional features, such as median price and sales absorption, be sure to check out the full reports. They can be found under each graph. In addition, please don’t hesitate to contact me to discuss how these stats affect the value of your home.

Gardnerville, NV:

November 2023 Residential Stats: Supply & Demand graph for Gardnerville, NV

For the full November report for Gardnerville, NV, click here.

Minden, NV:

November 2023 Residential Stats: Supply & Demand graph for Minden, NV

For the full November report for Minden, NV, click here.

November 2023 Residential Stats for Carson City, NV:

November 2023 Residential Stats: Supply and Demand graph for Carson City, NV

For the full November report for Carson City, NV, click here.

Thinking About Moving Here?

Are you thinking about moving to the Carson Valley area? If so, be sure to check out my Area Information Center for helpful links to the area. In addition, VisitCarsonValley.org is a great resource for all things Carson Valley. I think you will love it here!

October 2023 Residential Stats

November 2, 2023 by admin

The October 2023 residential stats are now available. So let’s take a look at some of the key features. Below you will find snapshots showing the supply and demand for the Gardnerville, Minden, and Carson City markets. As you can see, the supply of available homes for sale is up 7.1% for Gardnerville compared to 2 years ago, up 13.2% for Minden, and it is up 9.2% for Carson City.

For additional features, such as median price and sales absorption, be sure to check out the full reports. They can be found under each graph. In addition, please don’t hesitate to contact me to discuss how these stats affect the value of your home.

Gardnerville, NV:

October 2023 Residential Stats: Supply & Demand graph for Gardnerville, NV

For the full October report for Gardnerville, NV, click here.

Minden, NV:

October 2023 Residential Stats: Supply & Demand graph for Minden, NV

For the full October report for Minden, NV, click here.

October 2023 Residential Stats for Carson City, NV:

October 2023 Residential Stats: Supply and Demand graph for Carson City, NV

For the full October report for Carson City, NV, click here.

Thinking About Moving Here?

Are you thinking about moving to the Carson Valley area? If so, be sure to check out my Area Information Center for helpful links to the area. In addition, VisitCarsonValley.org is a great resource for all things Carson Valley. I think you will love it here!

September 2023 Residential Stats

October 10, 2023 by admin

The September 2023 residential stats are now available. So let’s take a look at some of the key features. Below you will find snapshots showing the supply and demand for the Gardnerville, Minden, and Carson City markets. As you can see, the supply of available homes for sale is up 14.1% for Gardnerville compared to 2 years ago, up 7.4% for Minden, and it is down 6.4% for Carson City.

For additional features, such as median price and sales absorption, be sure to check out the full reports. They can be found under each graph. In addition, please don’t hesitate to contact me to discuss how these stats affect the value of your home.

Gardnerville, NV:

September 2023 Residential Stats: Supply & Demand graph for Gardnerville, NV

For the full September report for Gardnerville, NV, click here.

Minden, NV:

September 2023 Residential Stats: Supply & Demand graph for Minden, NV

For the full September report for Minden, NV, click here.

September 2023 Residential Stats for Carson City, NV:

September 2023 Residential Stats: Supply and Demand graph for Carson City, NV

For the full September report for Carson City, NV, click here.

Thinking About Moving Here?

Are you thinking about moving to the Carson Valley area? If so, be sure to check out my Area Information Center for helpful links to the area. In addition, VisitCarsonValley.org is a great resource for all things Carson Valley. I think you will love it here!

July 2023 Residential Stats

August 9, 2023 by admin

The July 2023 residential stats are now available. So let’s take a look at some of the key features. Below you will find snapshots showing the supply and demand for the Gardnerville, Minden, and Carson City markets. As you can see, the supply of available homes for sale is up 18.4% for Gardnerville compared to 2 years ago, up 50% for Minden, and it is up 9.6% for Carson City.

For additional features, such as median price and sales absorption, be sure to check out the full reports. They can be found under each graph. In addition, please don’t hesitate to contact me to discuss how these stats affect the value of your home.

Gardnerville, NV:

July 2023 Residential Stats: Supply & Demand graph for Gardnerville, NV

For the full July report for Gardnerville, NV, click here.

Minden, NV:

July 2023 Residential Stats: Supply & Demand graph for Minden, NV

For the full July report for Minden, NV, click here.

July 2023 Residential Stats for Carson City, NV:

July 2023 Residential Stats: Supply and Demand graph for Carson City, NV

For the full July report for Carson City, NV, click here.

Thinking About Moving Here?

Are you thinking about moving to the Carson Valley area? If so, be sure to check out my Area Information Center for helpful links to the area. In addition, VisitCarsonValley.org is a great resource for all things Carson Valley. I think you will love it here!

June 2023 Residential Stats

July 8, 2023 by admin

The June 2023 residential stats are now available. So let’s take a look at some of the key features. Below you will find snapshots showing the supply and demand for the Gardnerville, Minden, and Carson City markets. As you can see, the supply of available homes for sale is the same for Gardnerville compared to 2 years ago, up 103.3% for Minden, and it is up 12.8% for Carson City.

For additional features, such as median price and sales absorption, be sure to check out the full reports. They can be found under each graph. In addition, please don’t hesitate to contact me to discuss how these stats affect the value of your home.

Gardnerville, NV:

June 2023 Residential Stats: Supply & Demand graph for Gardnerville, NV

For the full June report for Gardnerville, NV, click here.

Minden, NV:

June 2023 Residential Stats: Supply & Demand graph for Minden, NV

For the full June report for Minden, NV, click here.

June 2023 Residential Stats for Carson City, NV:

June 2023 Residential Stats: Supply and Demand graph for Carson City, NV

For the full June report for Carson City, NV, click here.

Thinking About Moving Here?

Are you thinking about moving to the Carson Valley area? If so, be sure to check out my Area Information Center for helpful links to the area. In addition, VisitCarsonValley.org is a great resource for all things Carson Valley. I think you will love it here!

May 2023 Residential Stats

June 7, 2023 by admin

The May 2023 residential stats are now available. So let’s take a look at some of the key features. Below you will find snapshots showing the supply and demand for the Gardnerville, Minden, and Carson City markets. As you can see, the supply of available homes for sale is down 10.6% for Gardnerville compared to 2 years ago, up 106.5% for Minden, and it is up 28.1% for Carson City.

For additional features, such as median price and sales absorption, be sure to check out the full reports. They can be found under each graph. In addition, please don’t hesitate to contact me to discuss how these stats affect the value of your home.

Gardnerville, NV:

May 2023 Residential Stats: Supply & Demand graph for Gardnerville, NV

For the full May report for Gardnerville, NV, click here.

Minden, NV:

May 2023 Residential Stats: Supply & Demand graph for Minden, NV

For the full May report for Minden, NV, click here.

May 2023 Residential Stats for Carson City, NV:

May 2023 Residential Stats: Supply and Demand graph for Carson City, NV

For the full May report for Carson City, NV, click here.

Thinking About Moving Here?

Are you thinking about moving to the Carson Valley area? If so, be sure to check out my Area Information Center for helpful links to the area. In addition, VisitCarsonValley.org is a great resource for all things Carson Valley. I think you will love it here!

April 2023 Residential Stats

May 11, 2023 by admin

The April 2023 residential stats are now available. So let’s take a look at some of the key features. Below you will find snapshots showing the supply and demand for the Gardnerville, Minden, and Carson City markets. As you can see, the supply of available homes for sale is down 1.2% for Gardnerville compared to 2 years ago, up 200.0% for Minden, and it is up 30.1% for Carson City.

For additional features, such as median price and sales absorption, be sure to check out the full reports. They can be found under each graph. In addition, please don’t hesitate to contact me to discuss how these stats affect the value of your home.

Gardnerville, NV:

April 2023 Residential Stats: Supply & Demand graph for Gardnerville, NV

For the full April report for Gardnerville, NV, click here.

Minden, NV:

April 2023 Residential Stats: Supply & Demand graph for Minden, NV

For the full April report for Minden, NV, click here.

April 2023 Residential Stats for Carson City, NV:

April 2023 Residential Stats: Supply and Demand graph for Carson City, NV

For the full April report for Carson City, NV, click here.

Thinking About Moving Here?

Are you thinking about moving to the Carson Valley area? If so, be sure to check out my Area Information Center for helpful links to the area. In addition, VisitCarsonValley.org is a great resource for all things Carson Valley. I think you will love it here!

March 2023 Residential Stats

April 6, 2023 by admin

The March 2023 residential stats are now available. So let’s take a look at some of the key features. Below you will find snapshots showing the supply and demand for the Gardnerville, Minden, and Carson City markets. As you can see, the supply of available homes for sale is down 9.3% for Gardnerville compared to 2 years ago, up 53.1% for Minden, and it is up 16.3% for Carson City.

For additional features, such as median price and sales absorption, be sure to check out the full reports. They can be found under each graph. In addition, please don’t hesitate to contact me to discuss how these stats affect the value of your home.

Gardnerville, NV:

March 2023 Residential Stats: Supply & Demand graph for Gardnerville, NV

For the full March report for Gardnerville, NV, click here.

Minden, NV:

March 2023 Residential Stats: Supply & Demand graph for Minden, NV

For the full March report for Minden, NV, click here.

March 2023 Residential Stats for Carson City, NV:

March 2023 Residential Stats: Supply and Demand graph for Carson City, NV

For the full March report for Carson City, NV, click here.

Thinking About Moving Here?

Are you thinking about moving to the Carson Valley area? If so, be sure to check out my Area Information Center for helpful links to the area. In addition, VisitCarsonValley.org is a great resource for all things Carson Valley. I think you will love it here!

January 2023 Residential Stats

February 8, 2023 by admin

The January 2023 residential stats are now available. So let’s take a look at some of the key features. Below you will find snapshots showing the supply and demand for the Gardnerville, Minden, and Carson City markets. As you can see, the supply of available homes for sale is up 15.5% for Gardnerville compared to 2 years ago, up 53.1% for Minden, and it is up 78.6% for Carson City.

For additional features, such as median price and sales absorption, be sure to check out the full reports. They can be found under each graph. In addition, please don’t hesitate to contact me to discuss how these stats affect the value of your home.

Gardnerville, NV:

January 2023 Residential Stats: Supply & Demand graph for Gardnerville, NV

For the full January report for Gardnerville, NV, click here.

Minden, NV:

January 2023 Residential Stats: Supply & Demand graph for Minden, NV

For the full January report for Minden, NV, click here.

January 2023 Residential Stats for Carson City, NV:

January 2023 Residential Stats: Supply and Demand graph for Carson City, NV

For the full January report for Carson City, NV, click here.

Thinking About Moving Here?

Are you thinking about moving to the Carson Valley area? If so, be sure to check out my Area Information Center for helpful links to the area. In addition, VisitCarsonValley.org is a great resource for all things Carson Valley. I think you will love it here!

  • « Previous Page
  • 1
  • 2
  • 3
  • 4
  • 5
  • Next Page »

Categories

Contact

Diane Bartsch, REALTOR®, CRS
NV Lic #S0024801
(775) 781-5050 Cell
(775) 782-8777 x 246 Office
Contact Diane

Recent News

  • SOLD! 2963 San Fernando Drive
  • October 2024 Market Report
  • September 2024 Market Report


sitemap   •   admin   •   ©2025 All Rights Reserved  •  Real Estate Website Design by IDXCentral.com

…