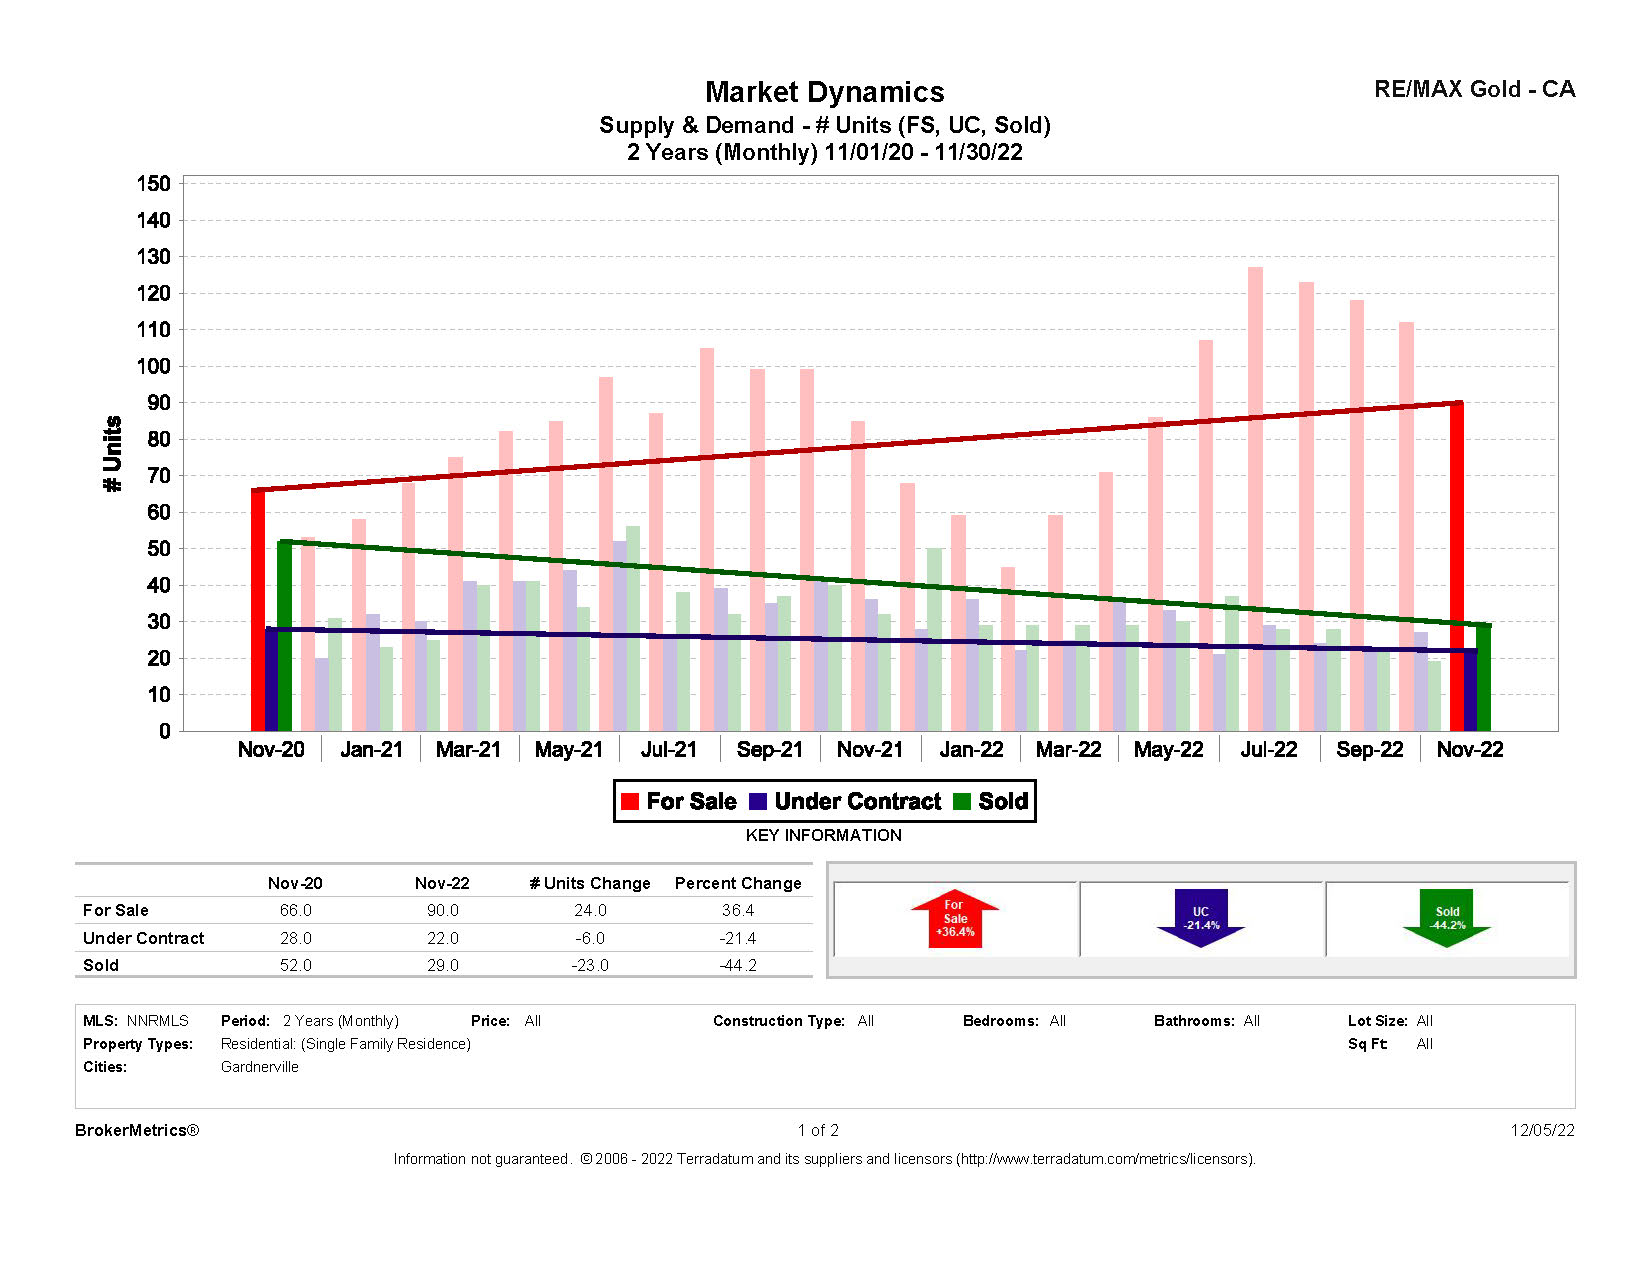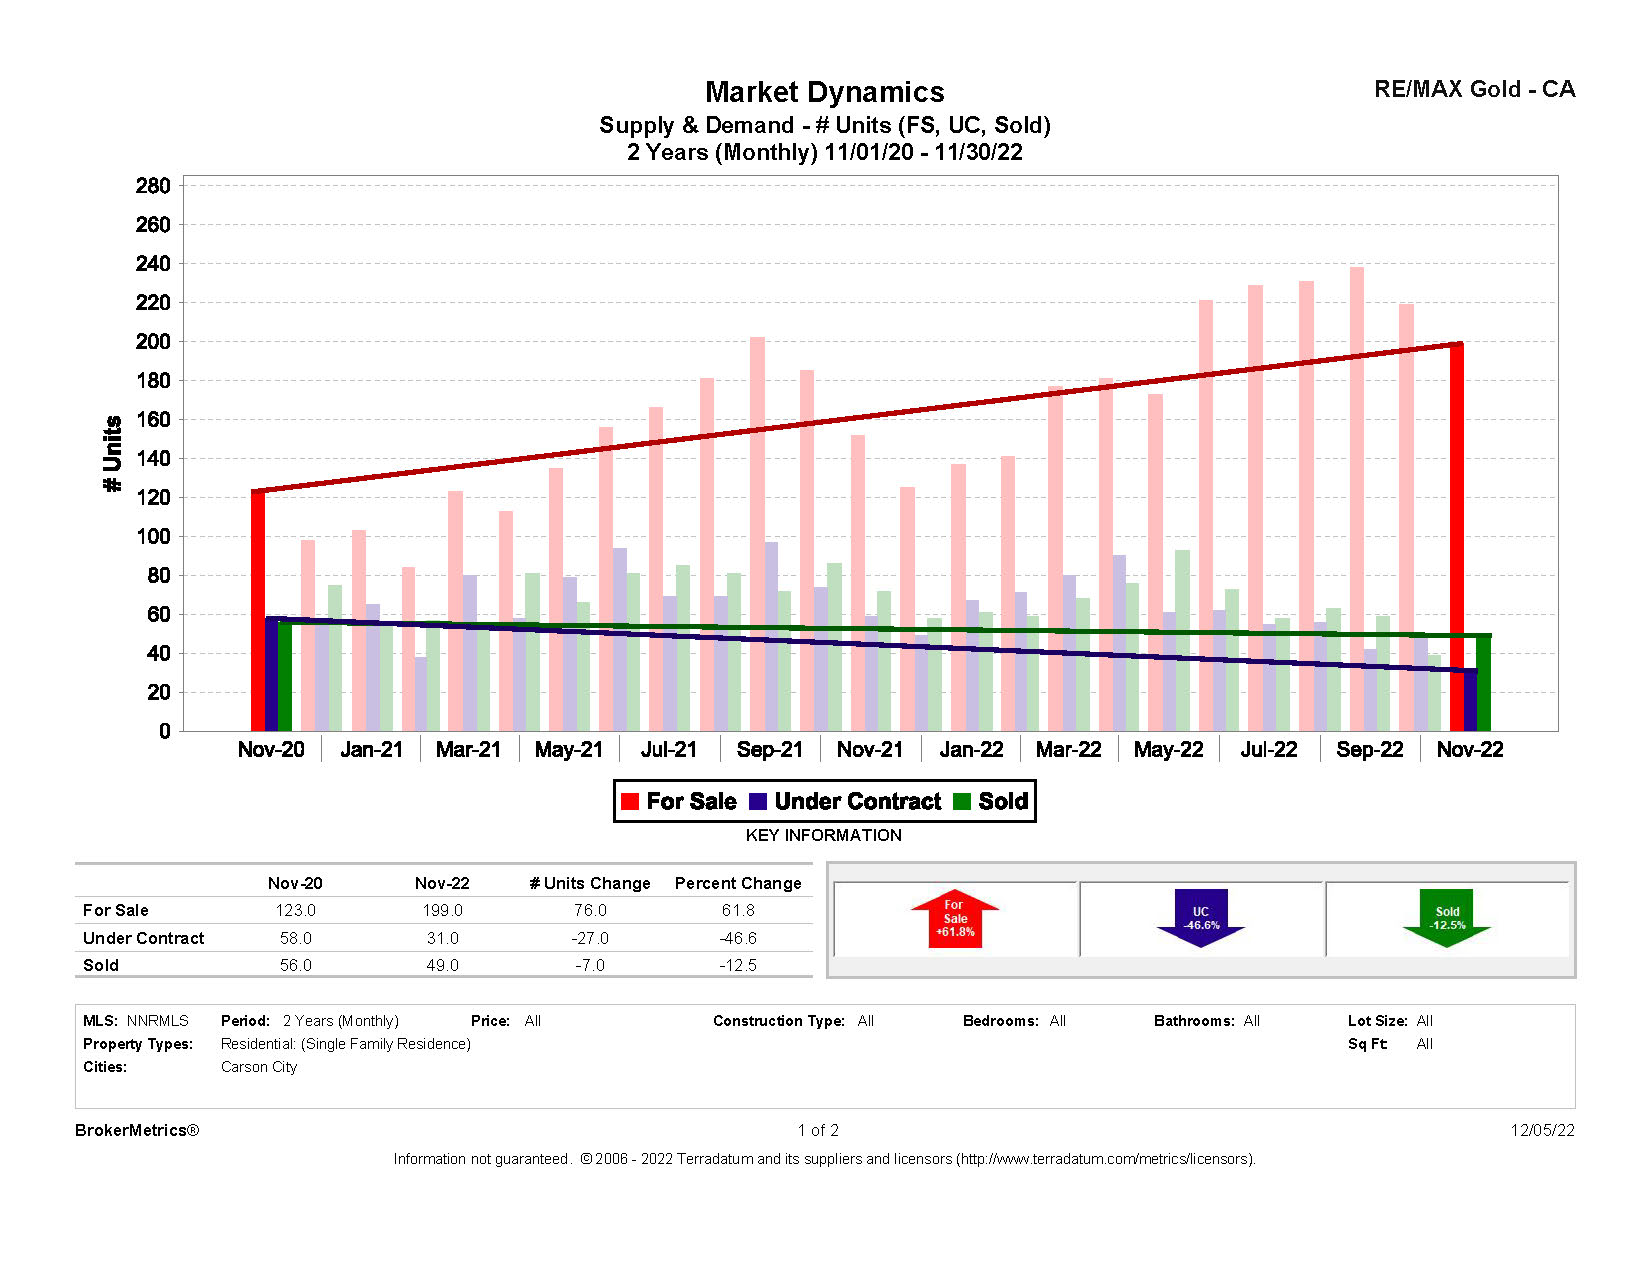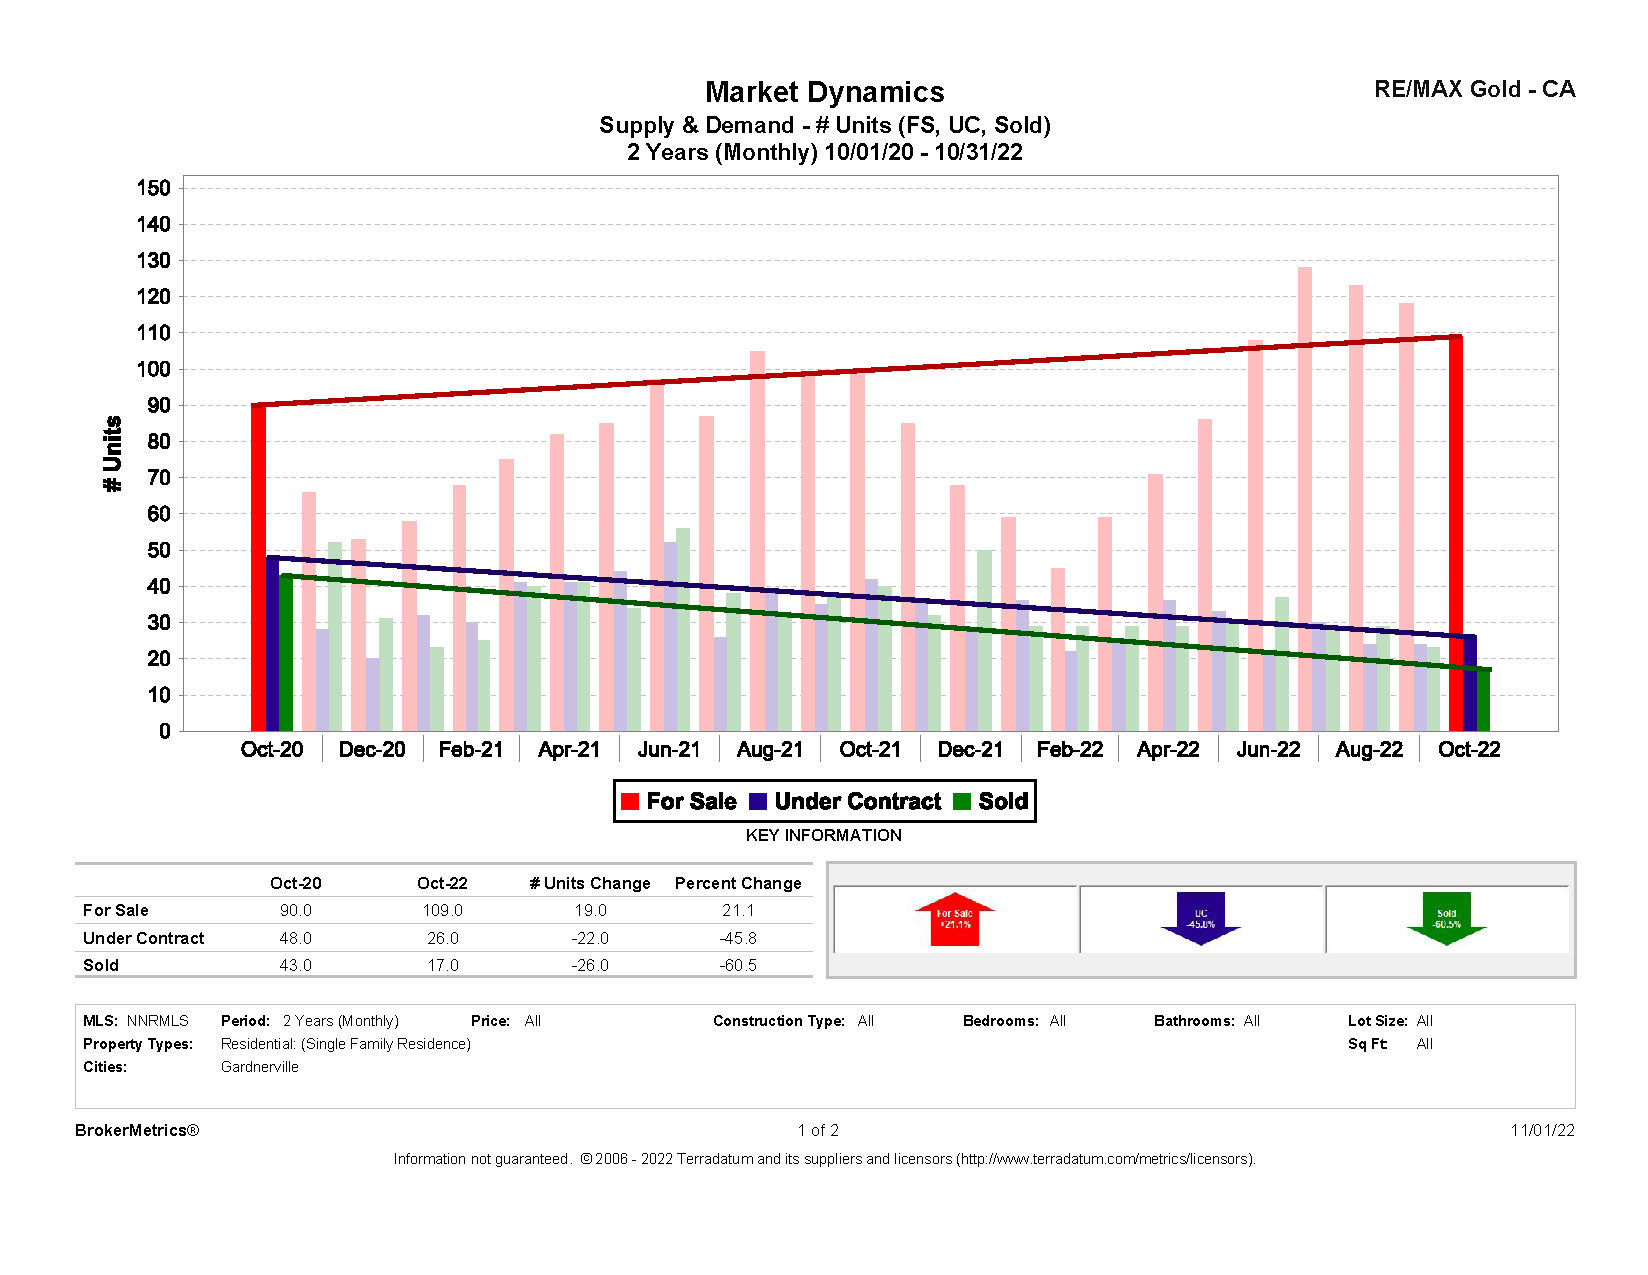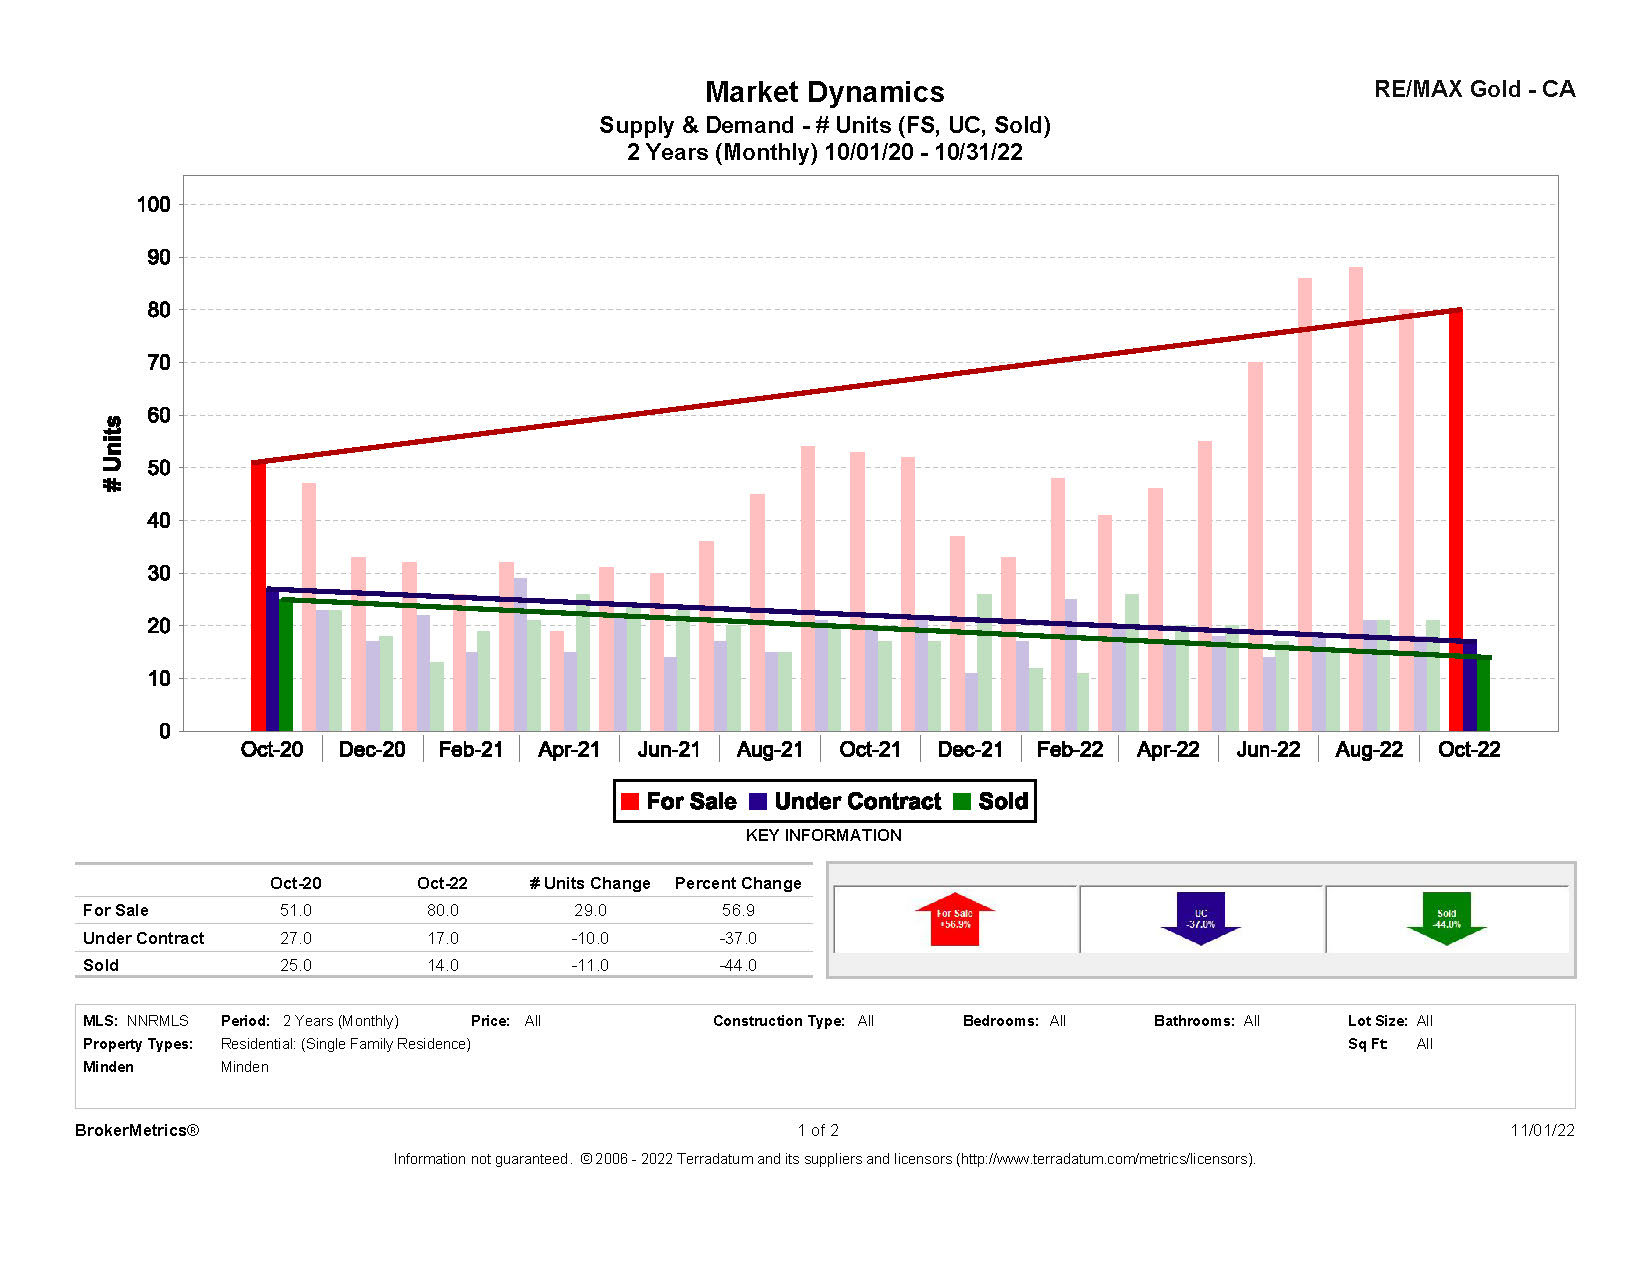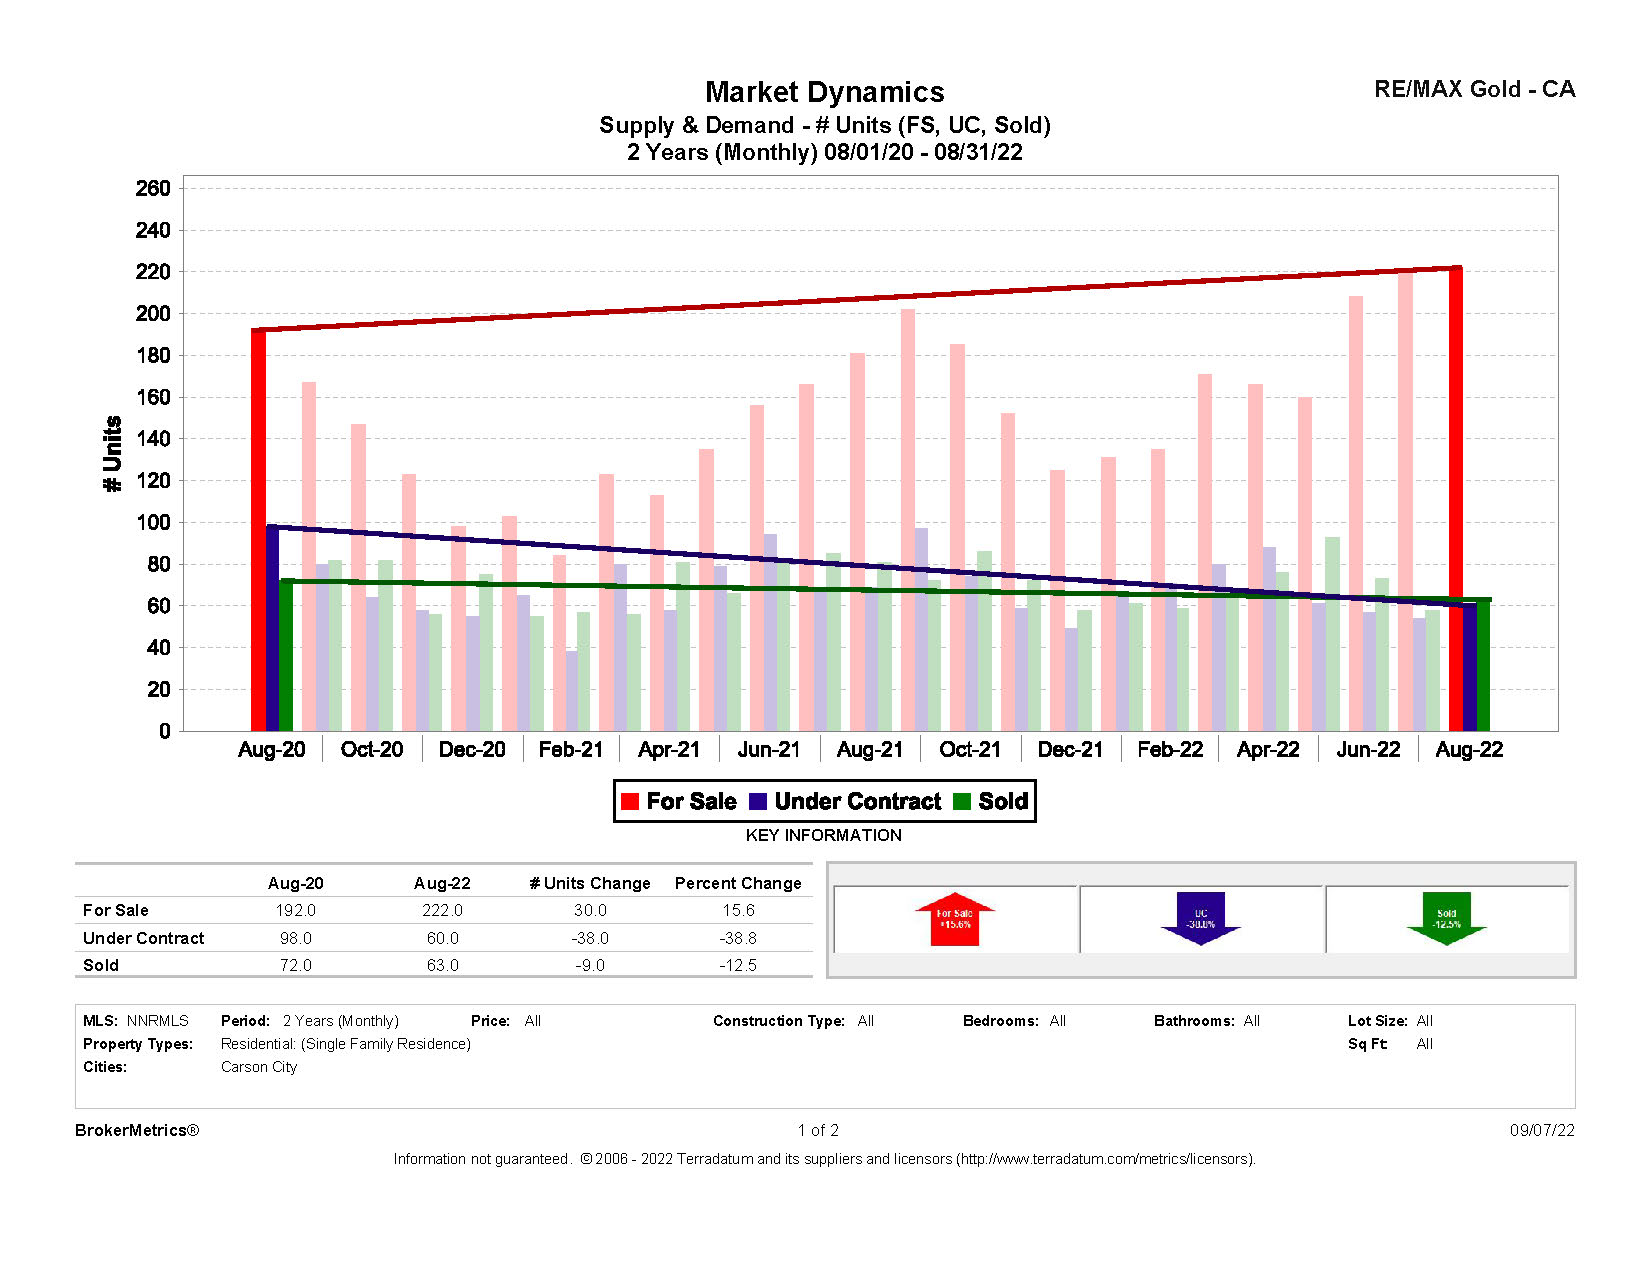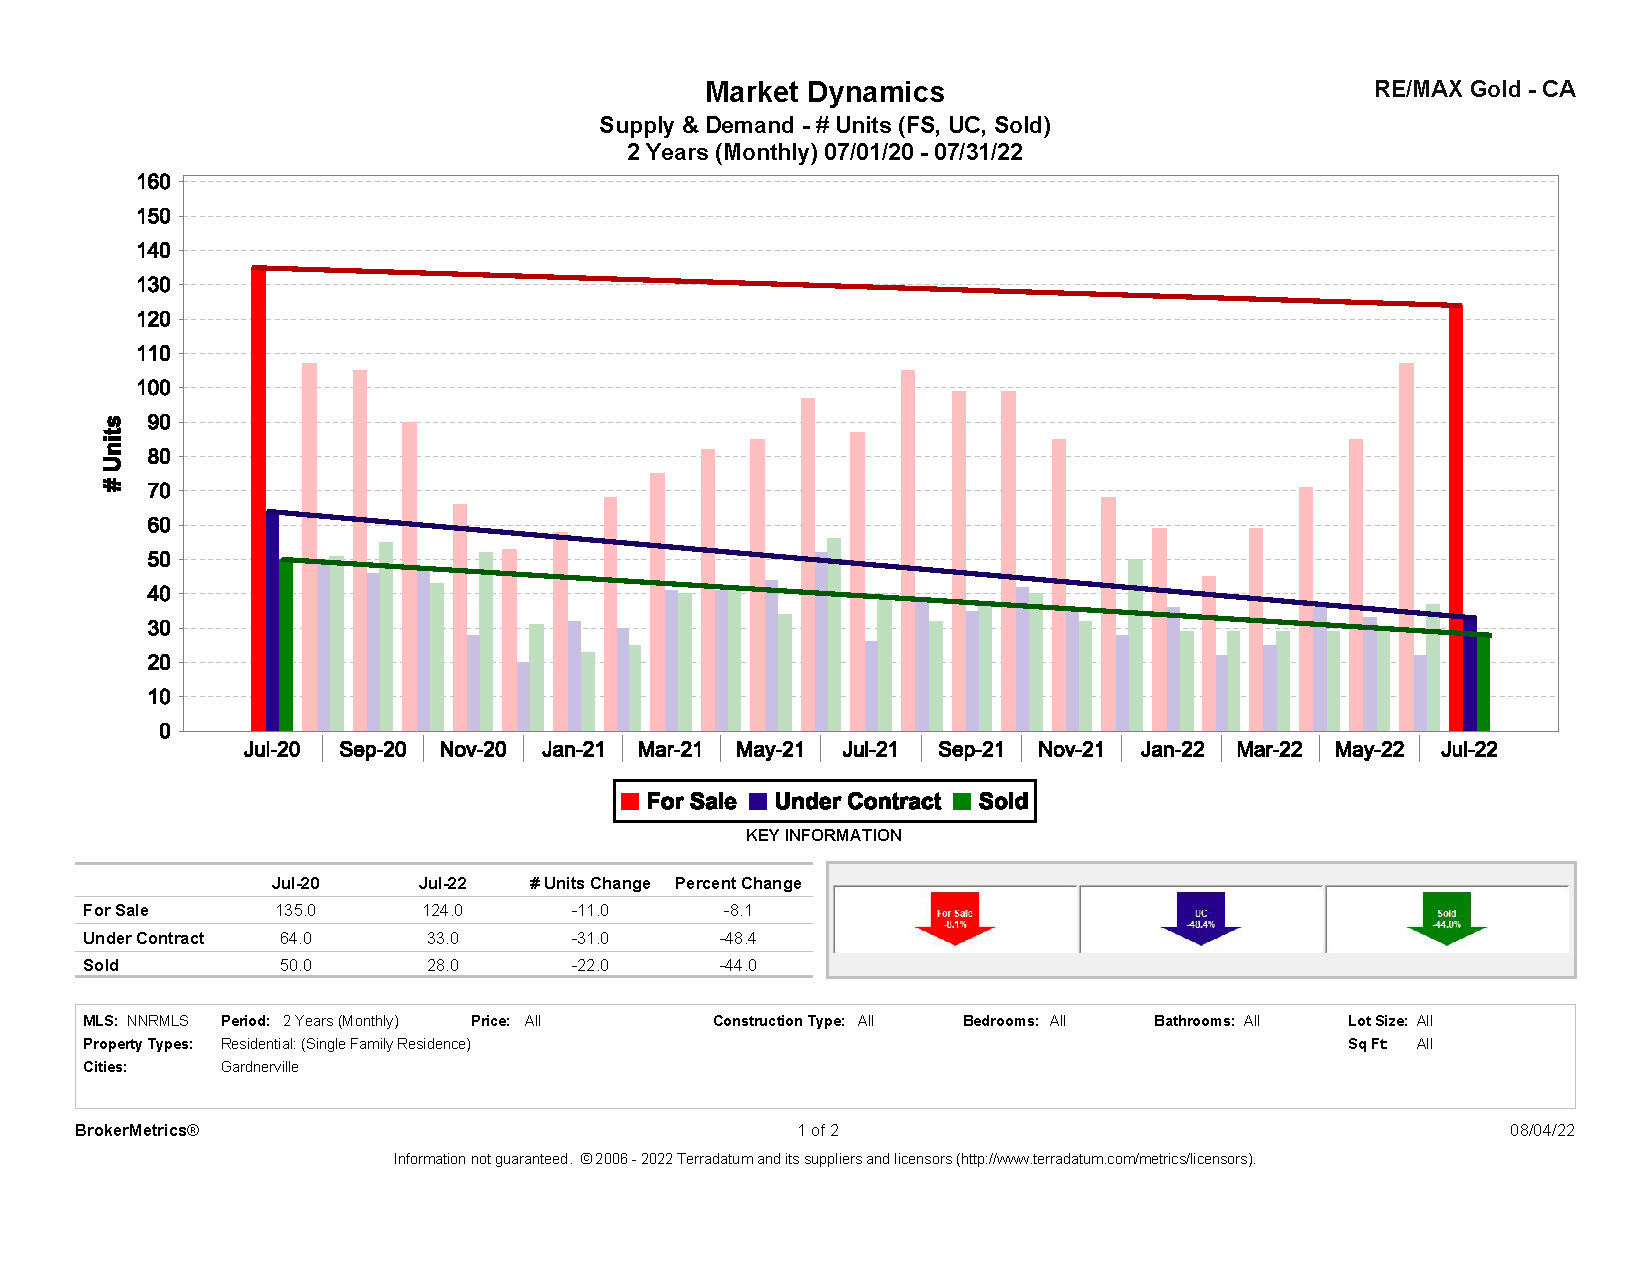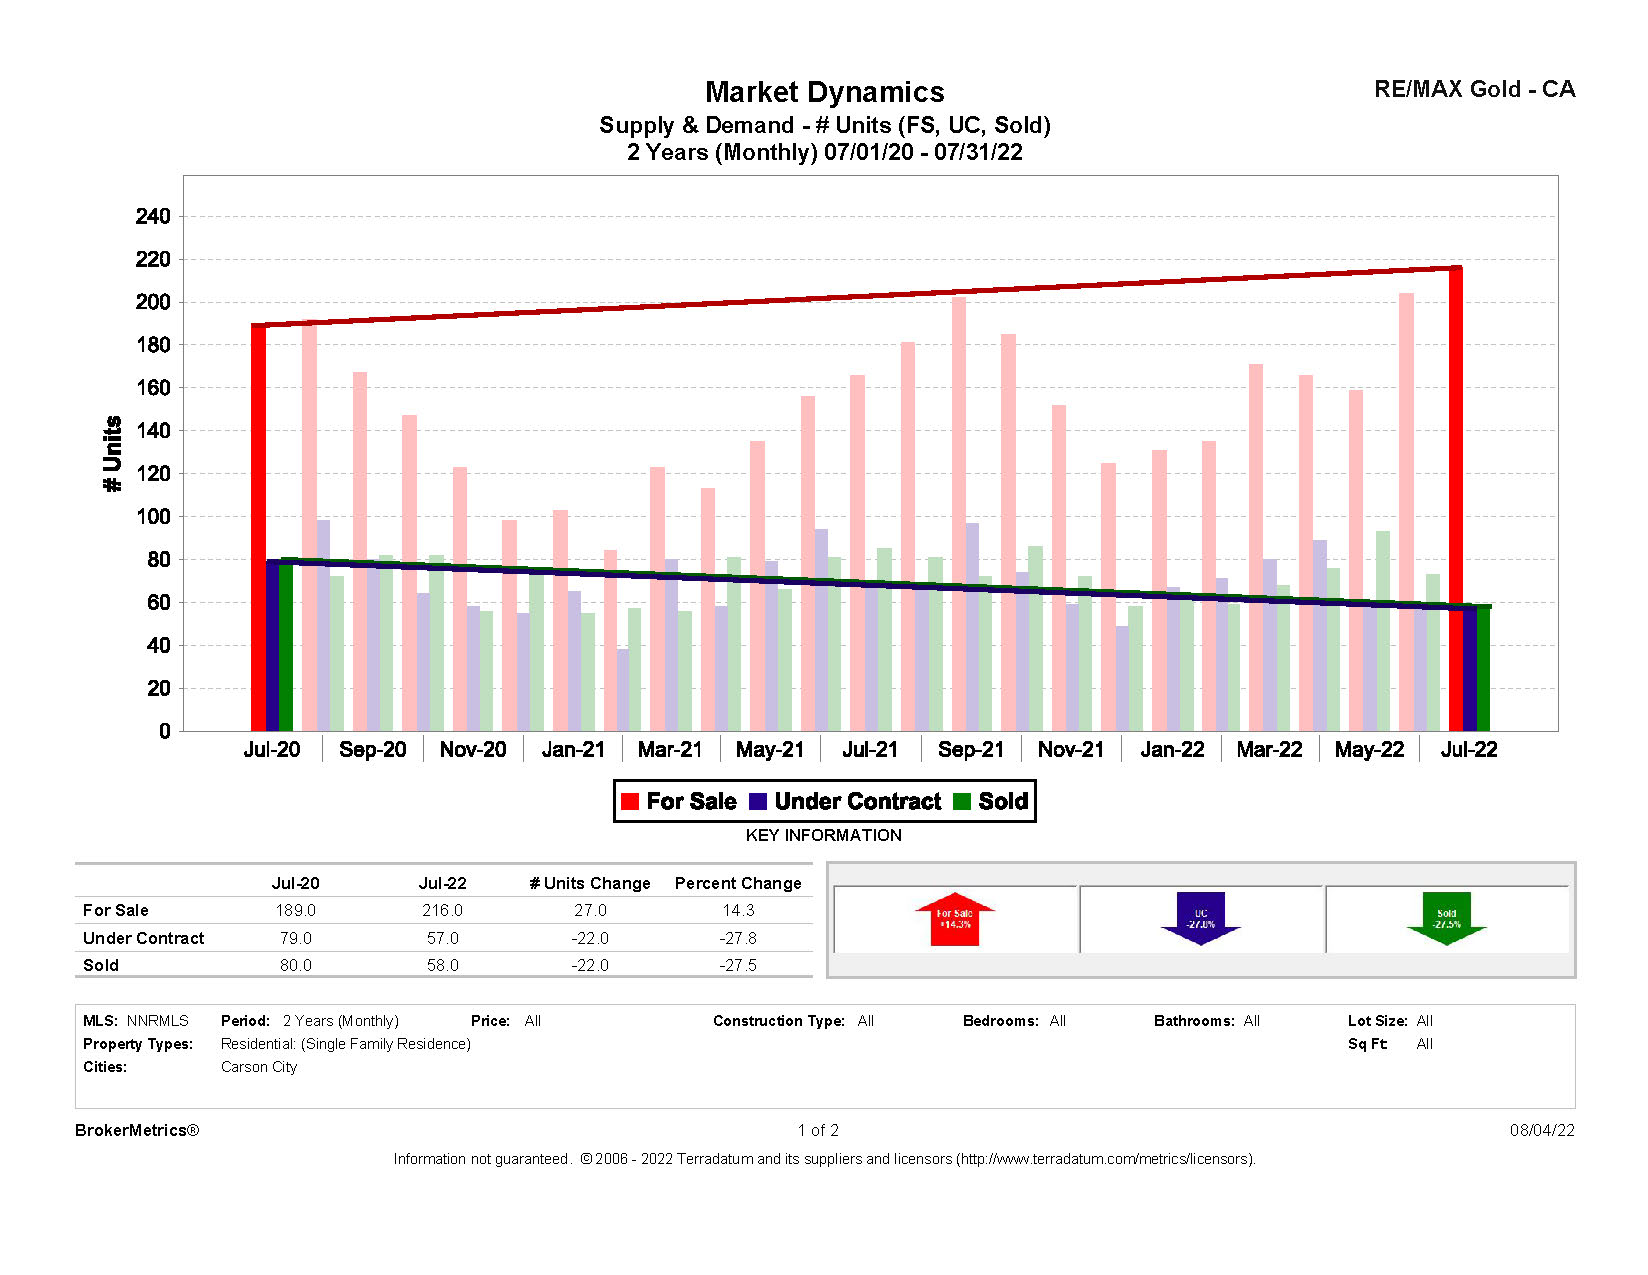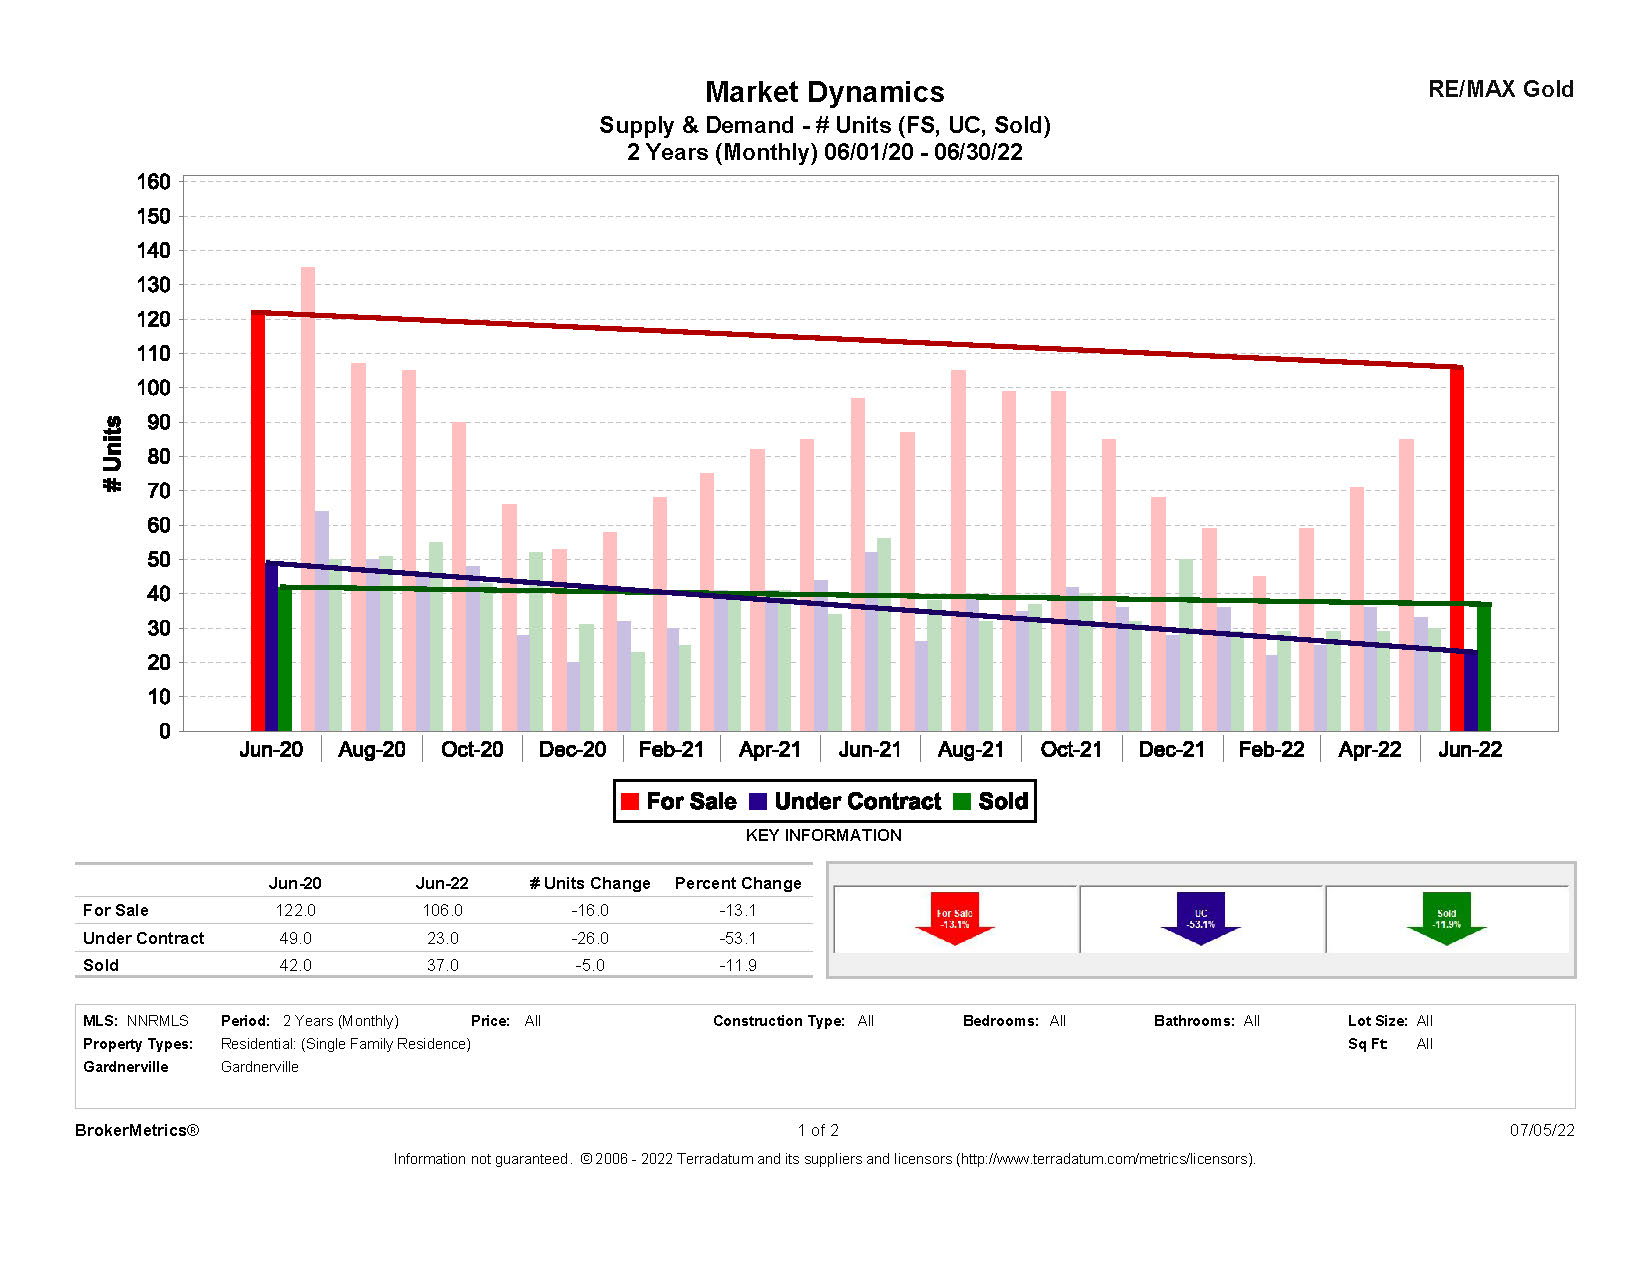
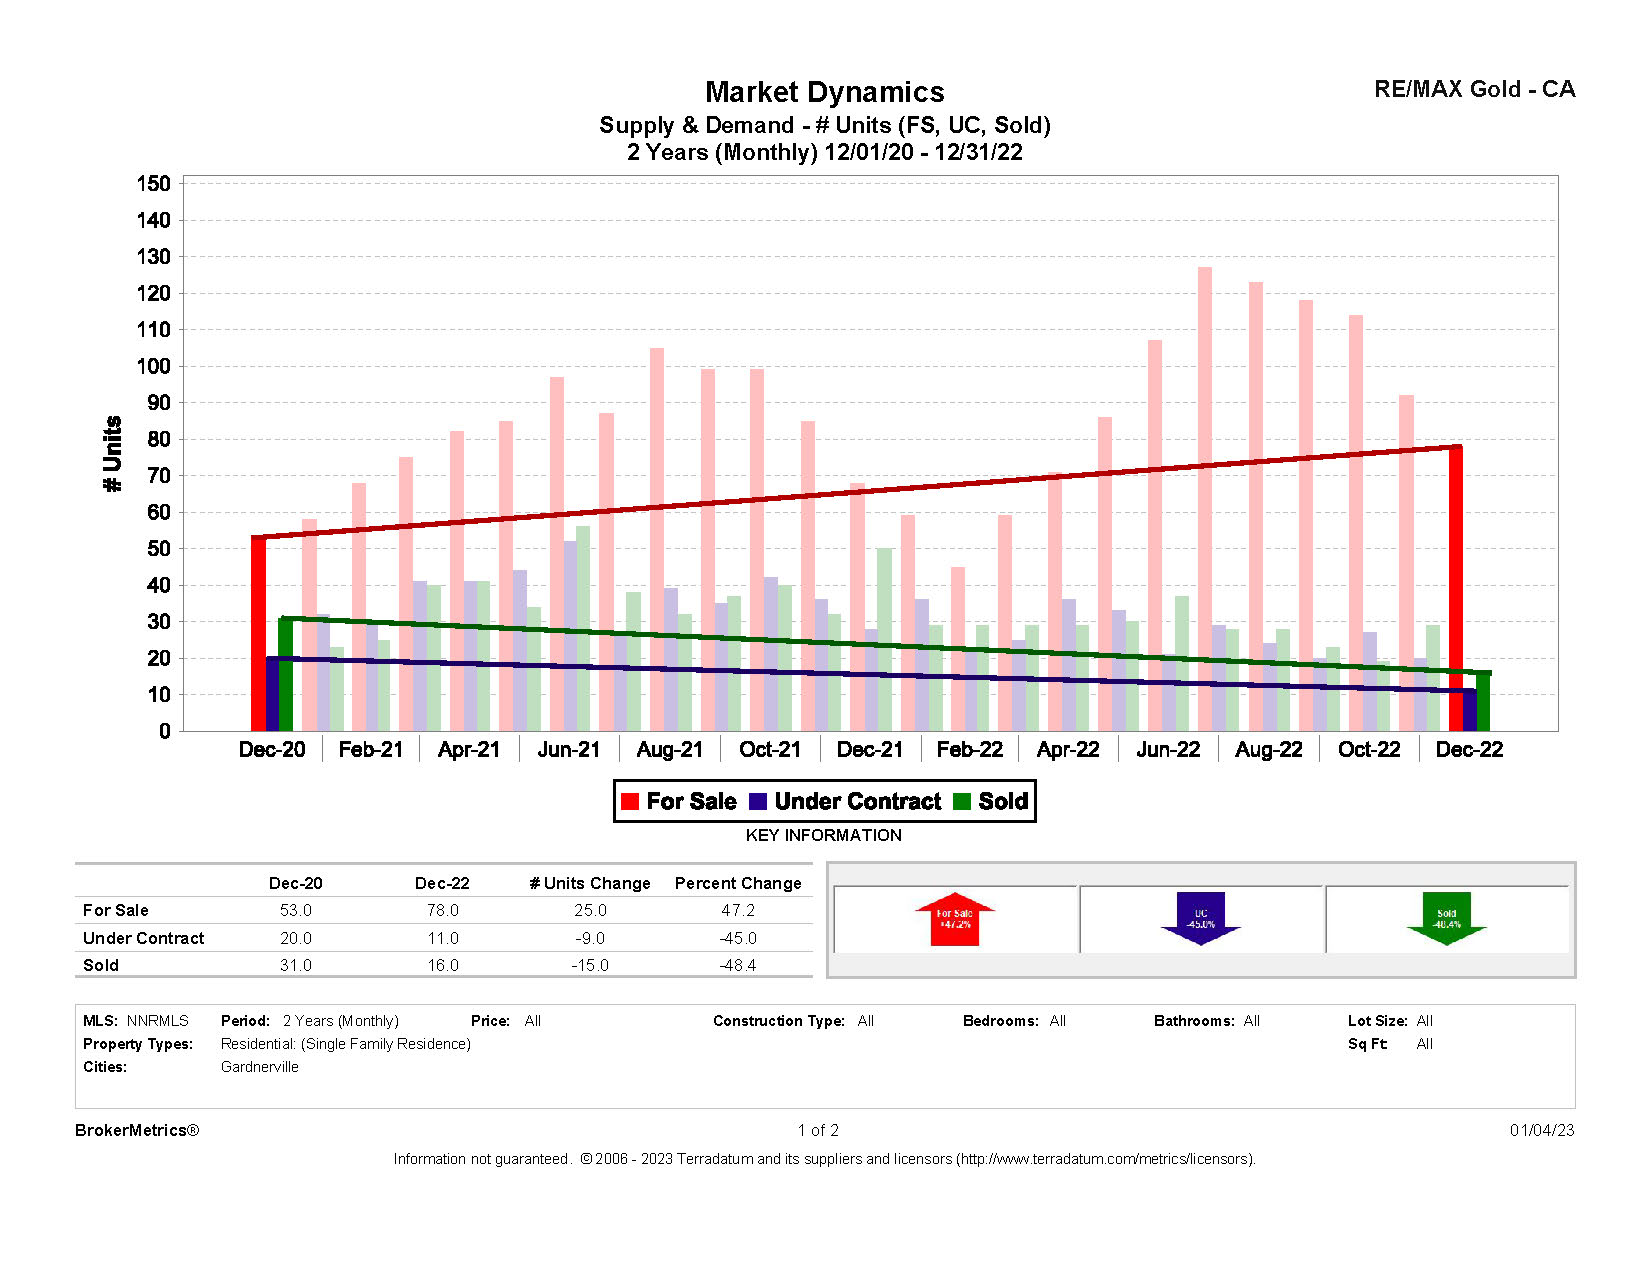
The December 2022 residential stats are now available. So let’s take a look at some of the key features. Below you will find snapshots showing the supply and demand for the Gardnerville, Minden, and Carson City markets. As you can see, the supply of available homes for sale is up 47.2% for Gardnerville compared to 2 years ago, up 90.9% for Minden, and it is up 101.0% for Carson City.
For additional features, such as median price and sales absorption, be sure to check out the full reports. They can be found under each graph. In addition, please don’t hesitate to contact me to discuss how these stats affect the value of your home.
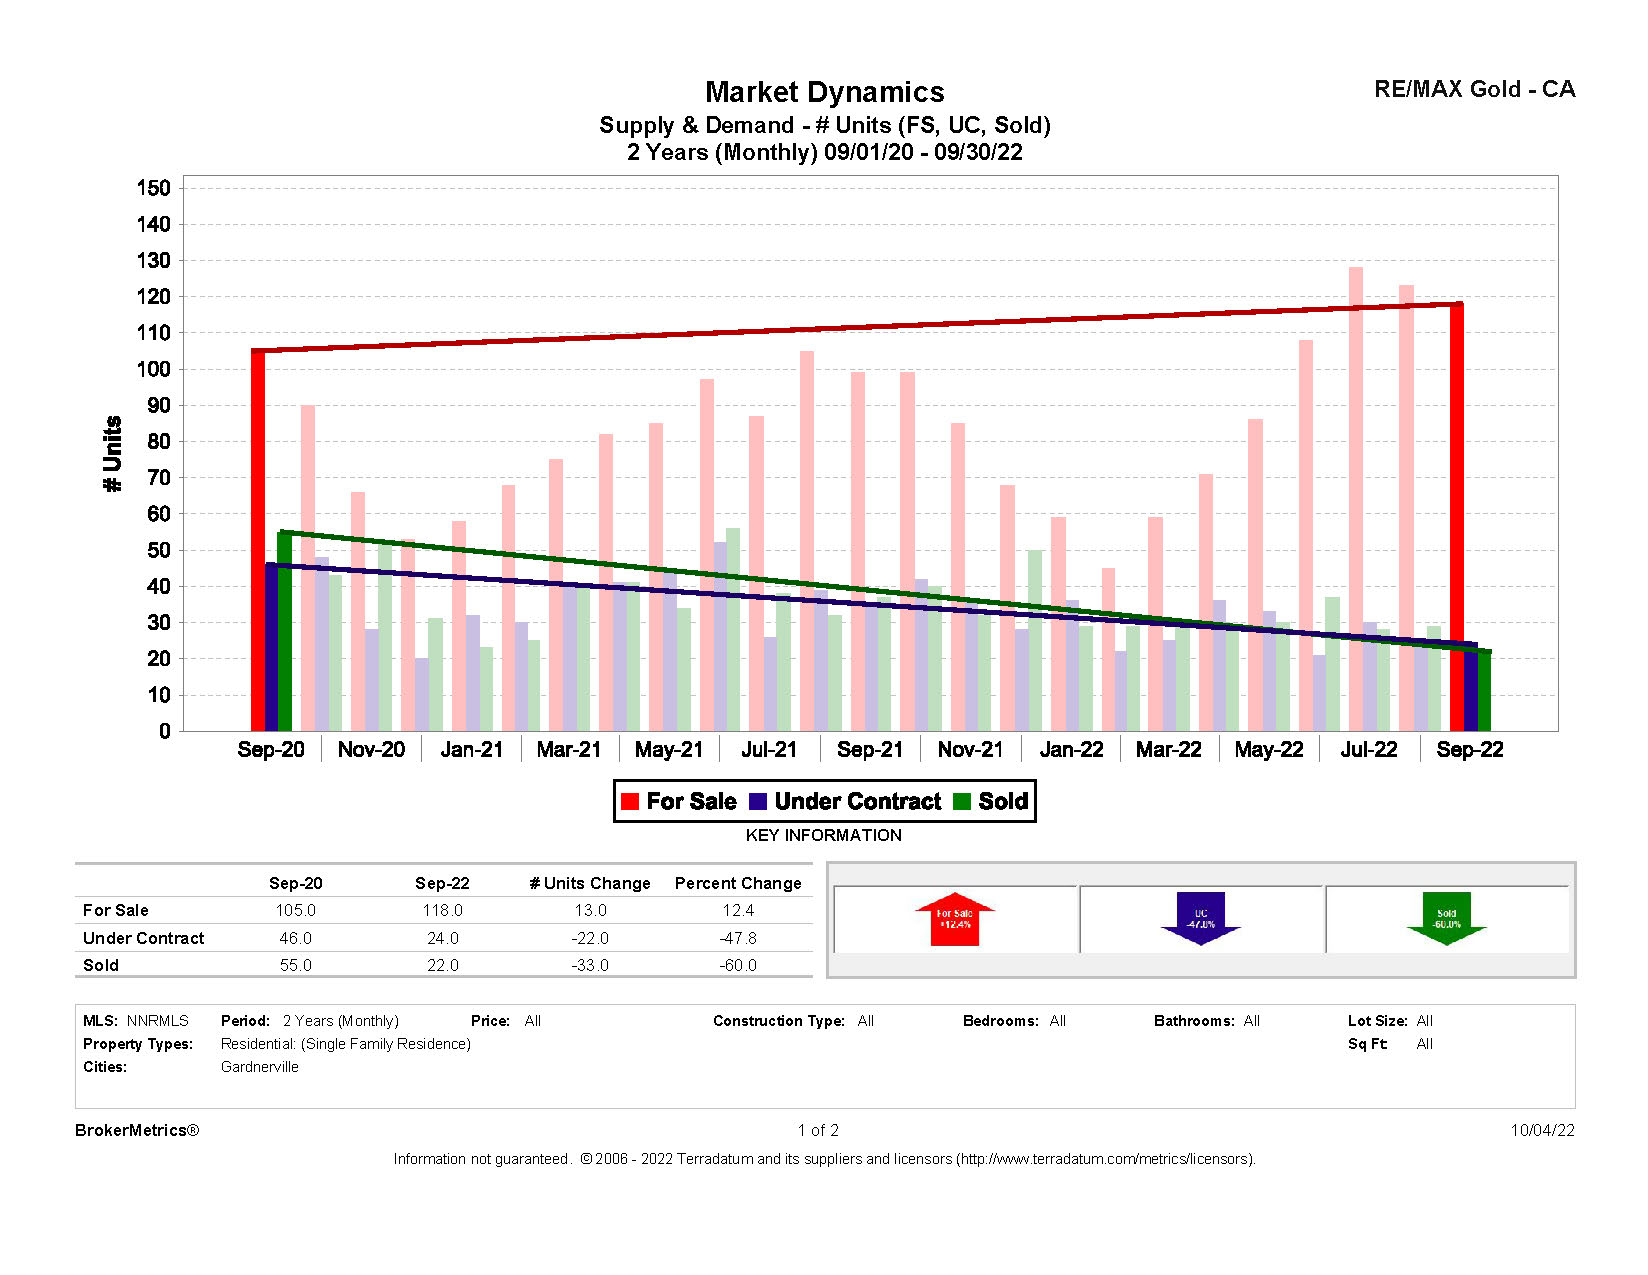
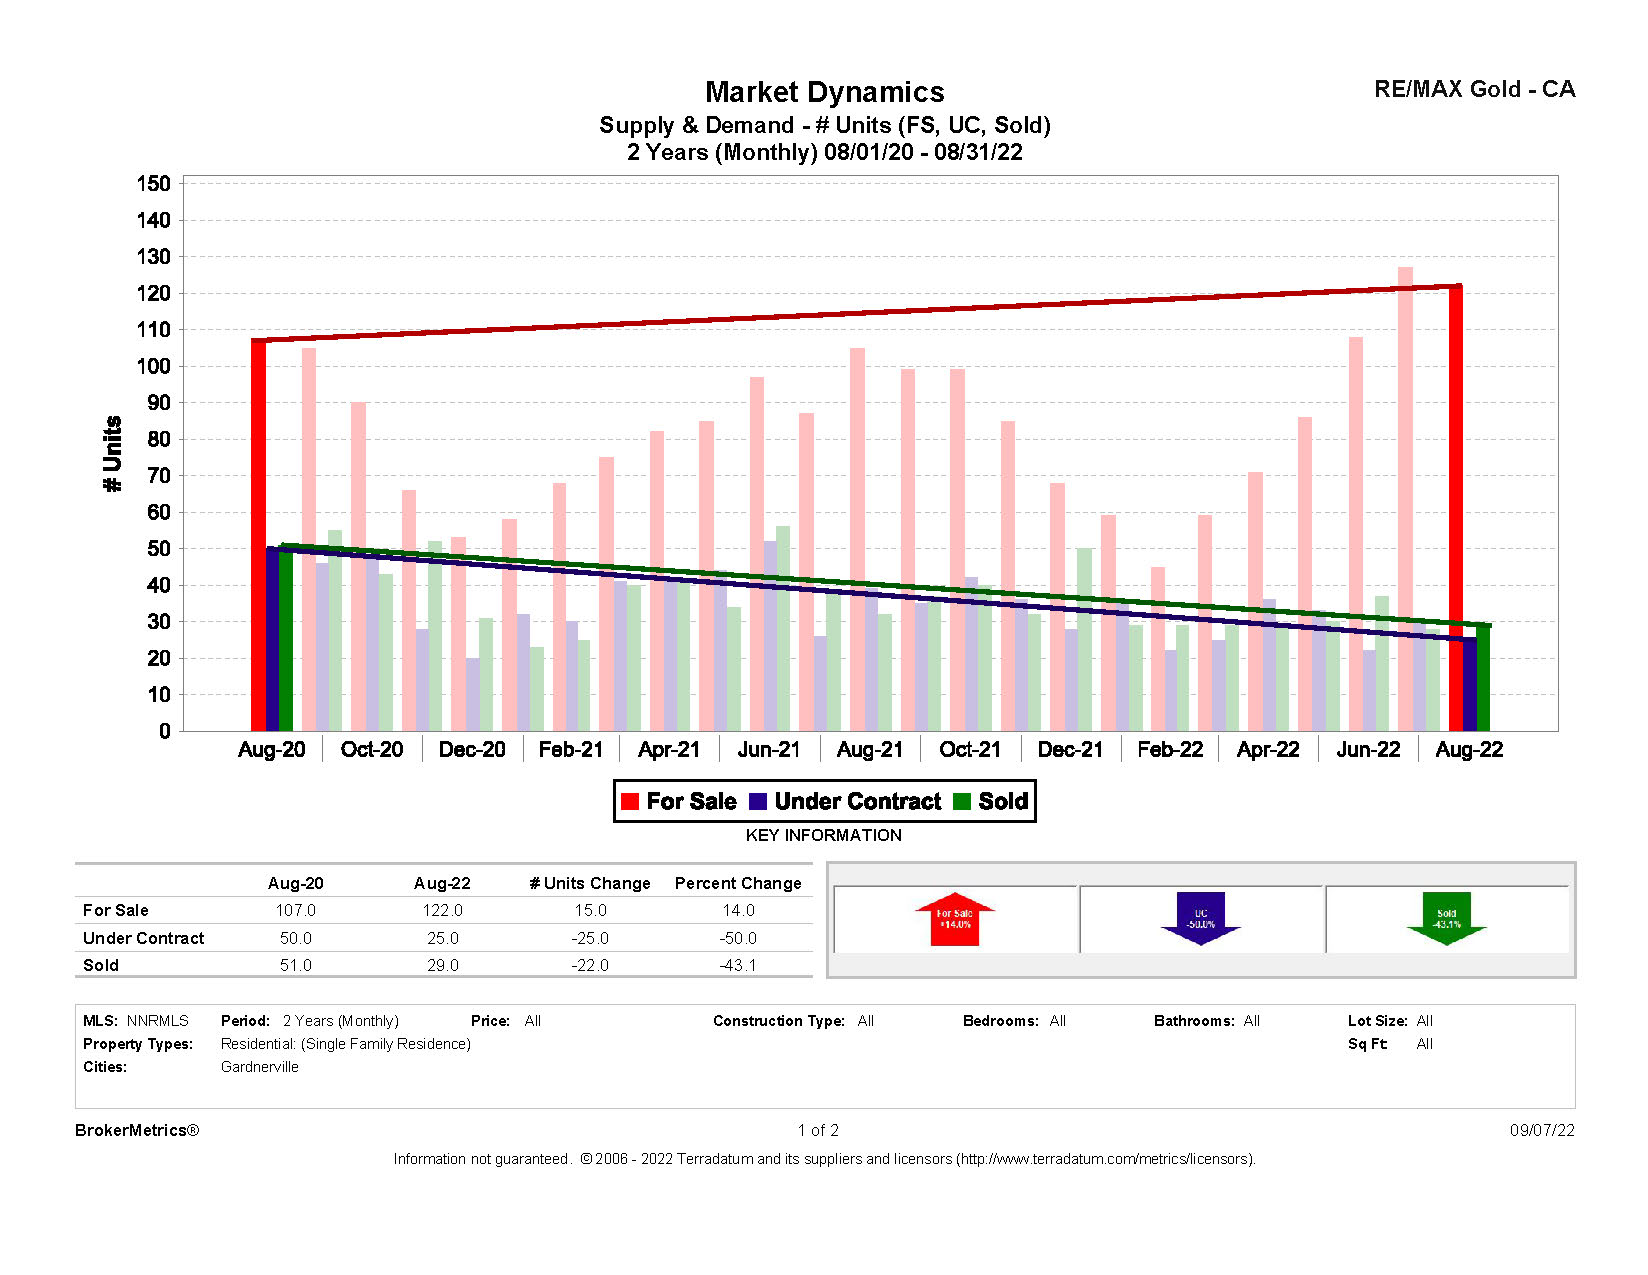
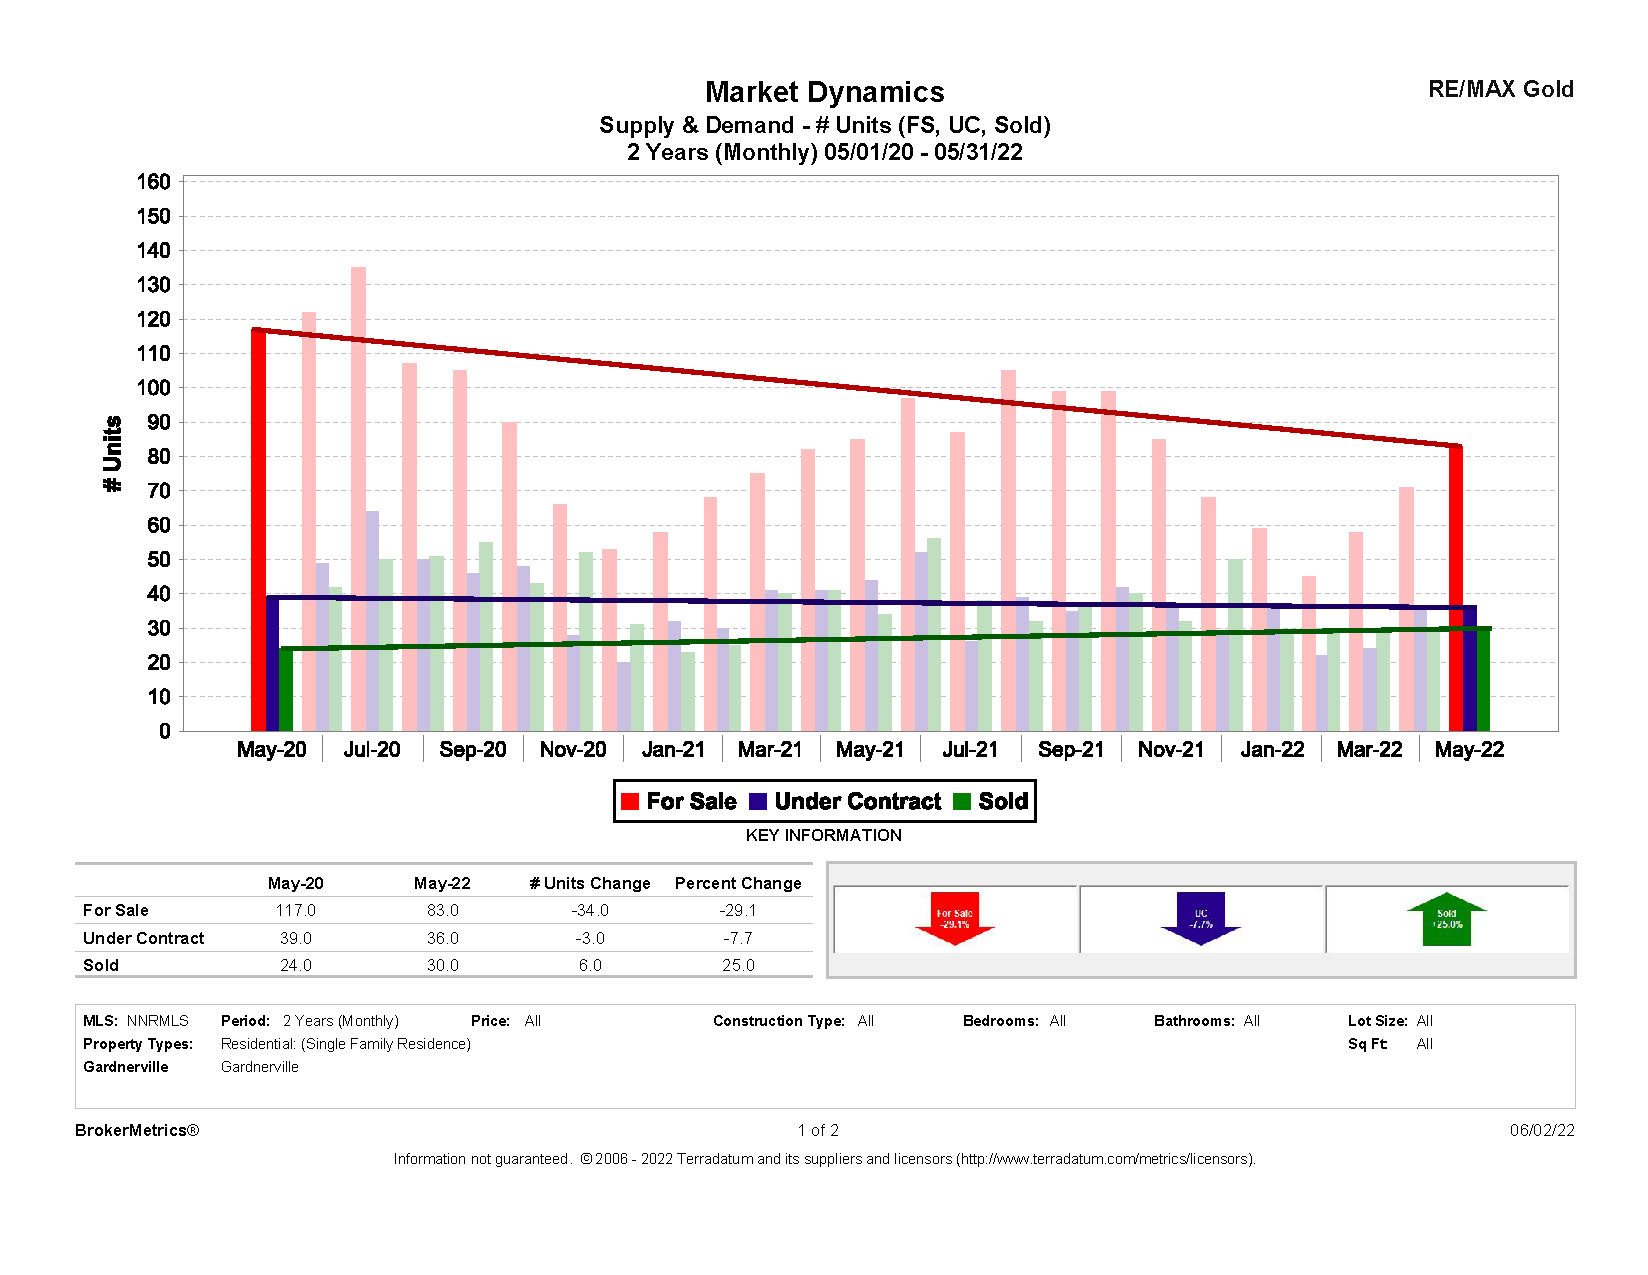
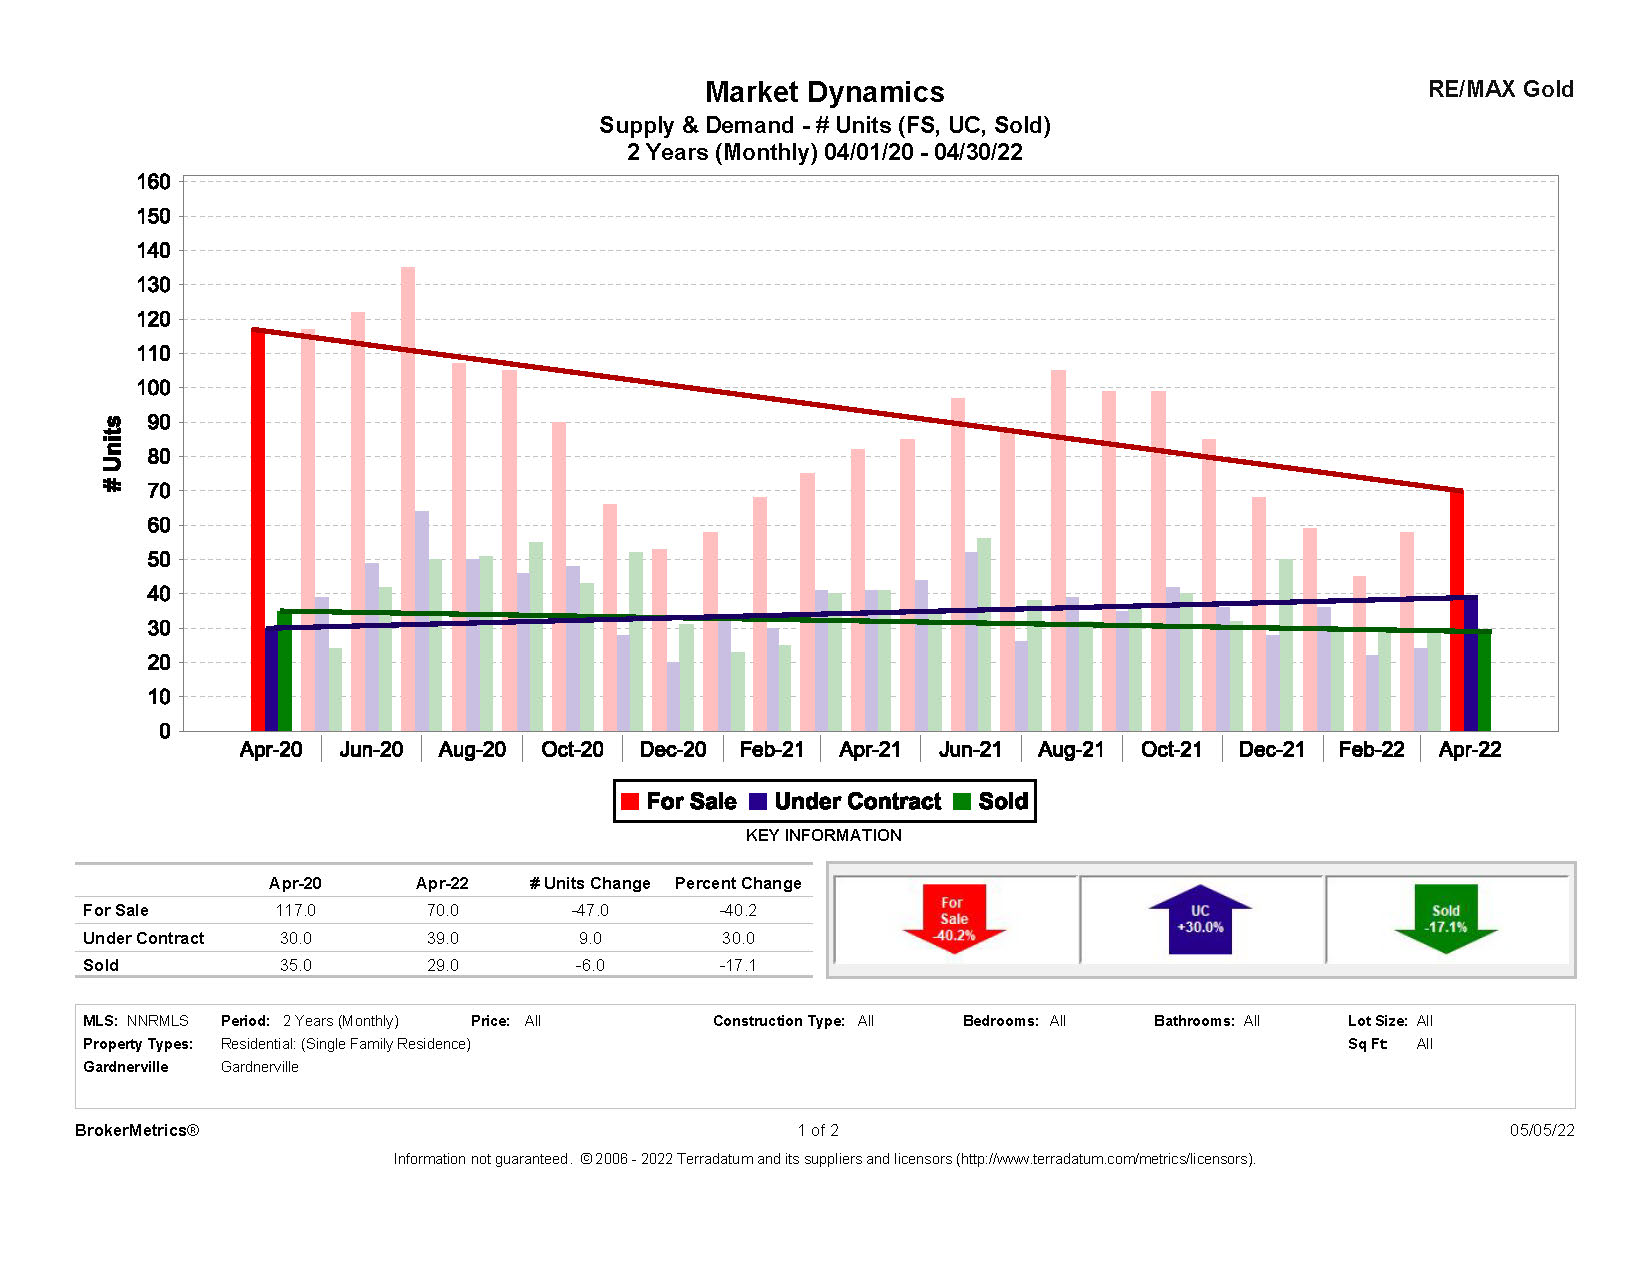
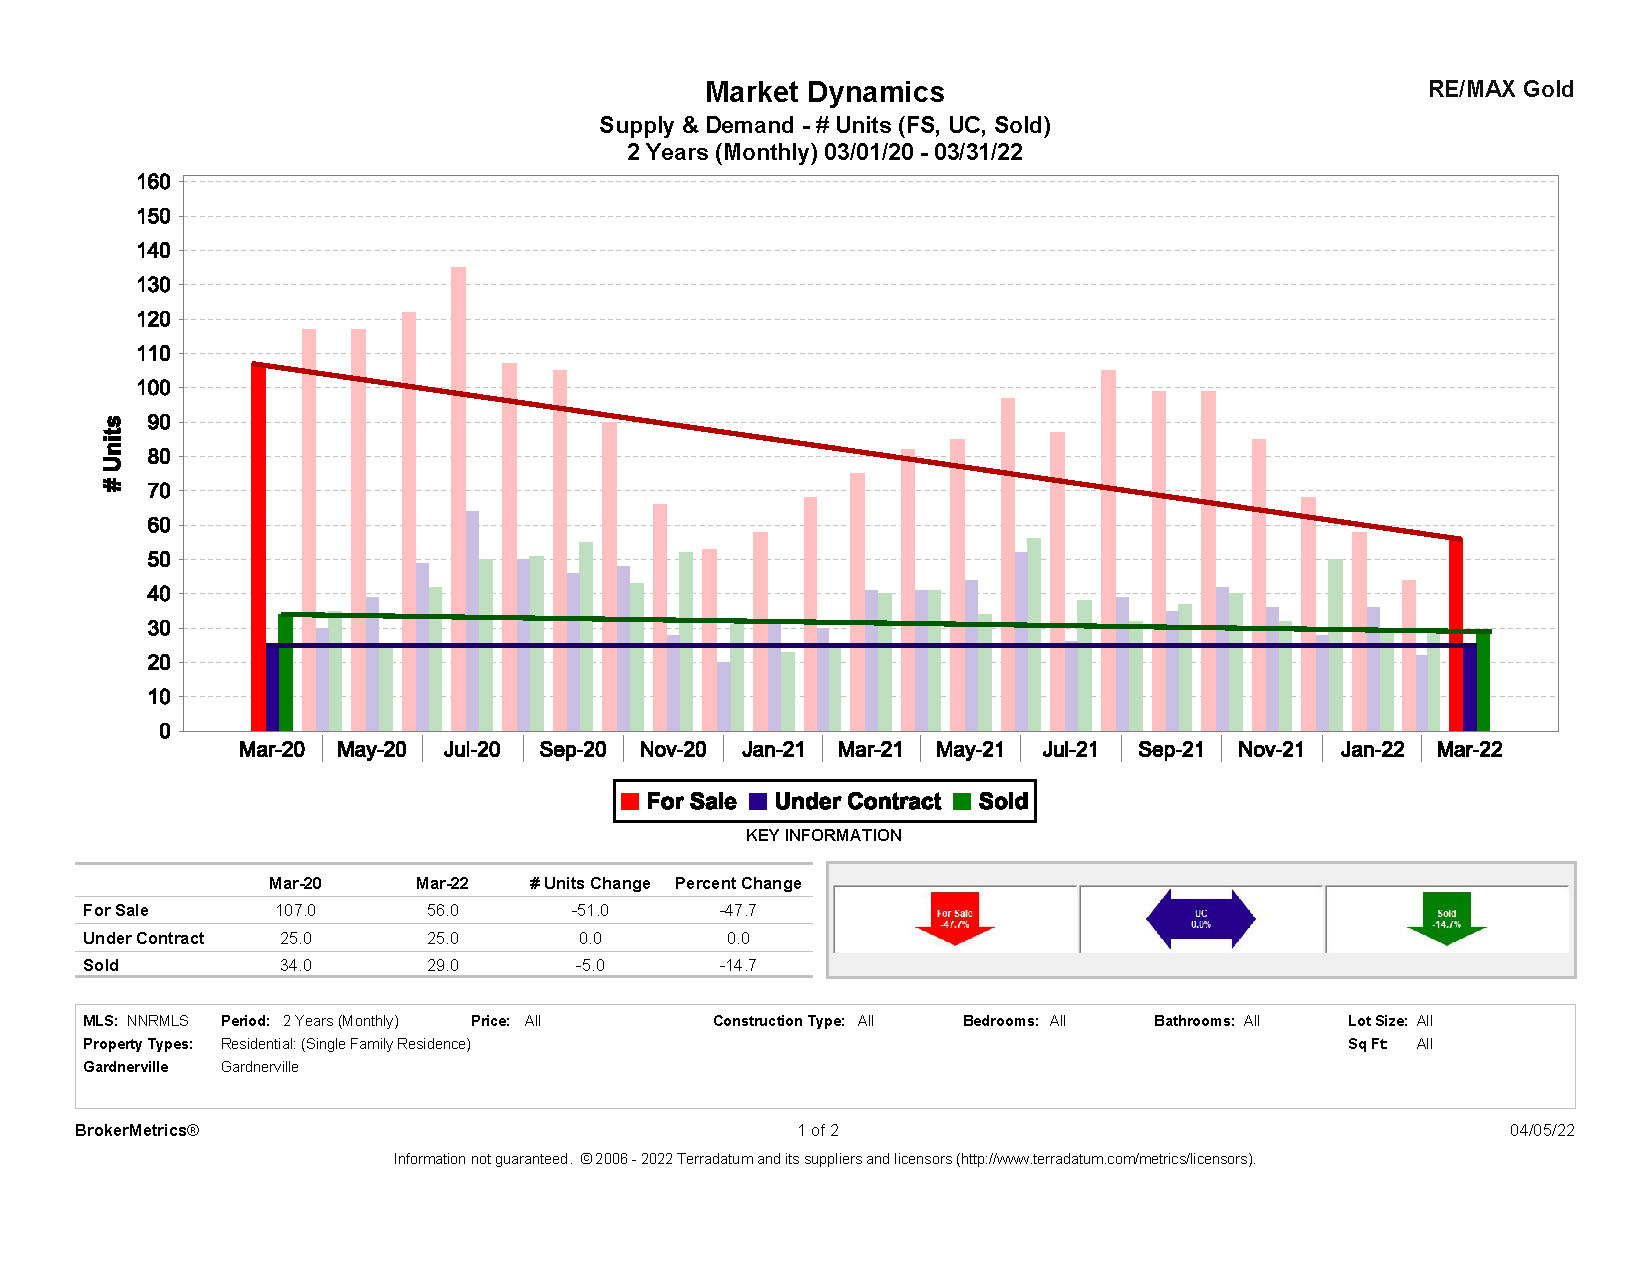
Gardnerville, NV:
For the full December report for Gardnerville, NV, click here.
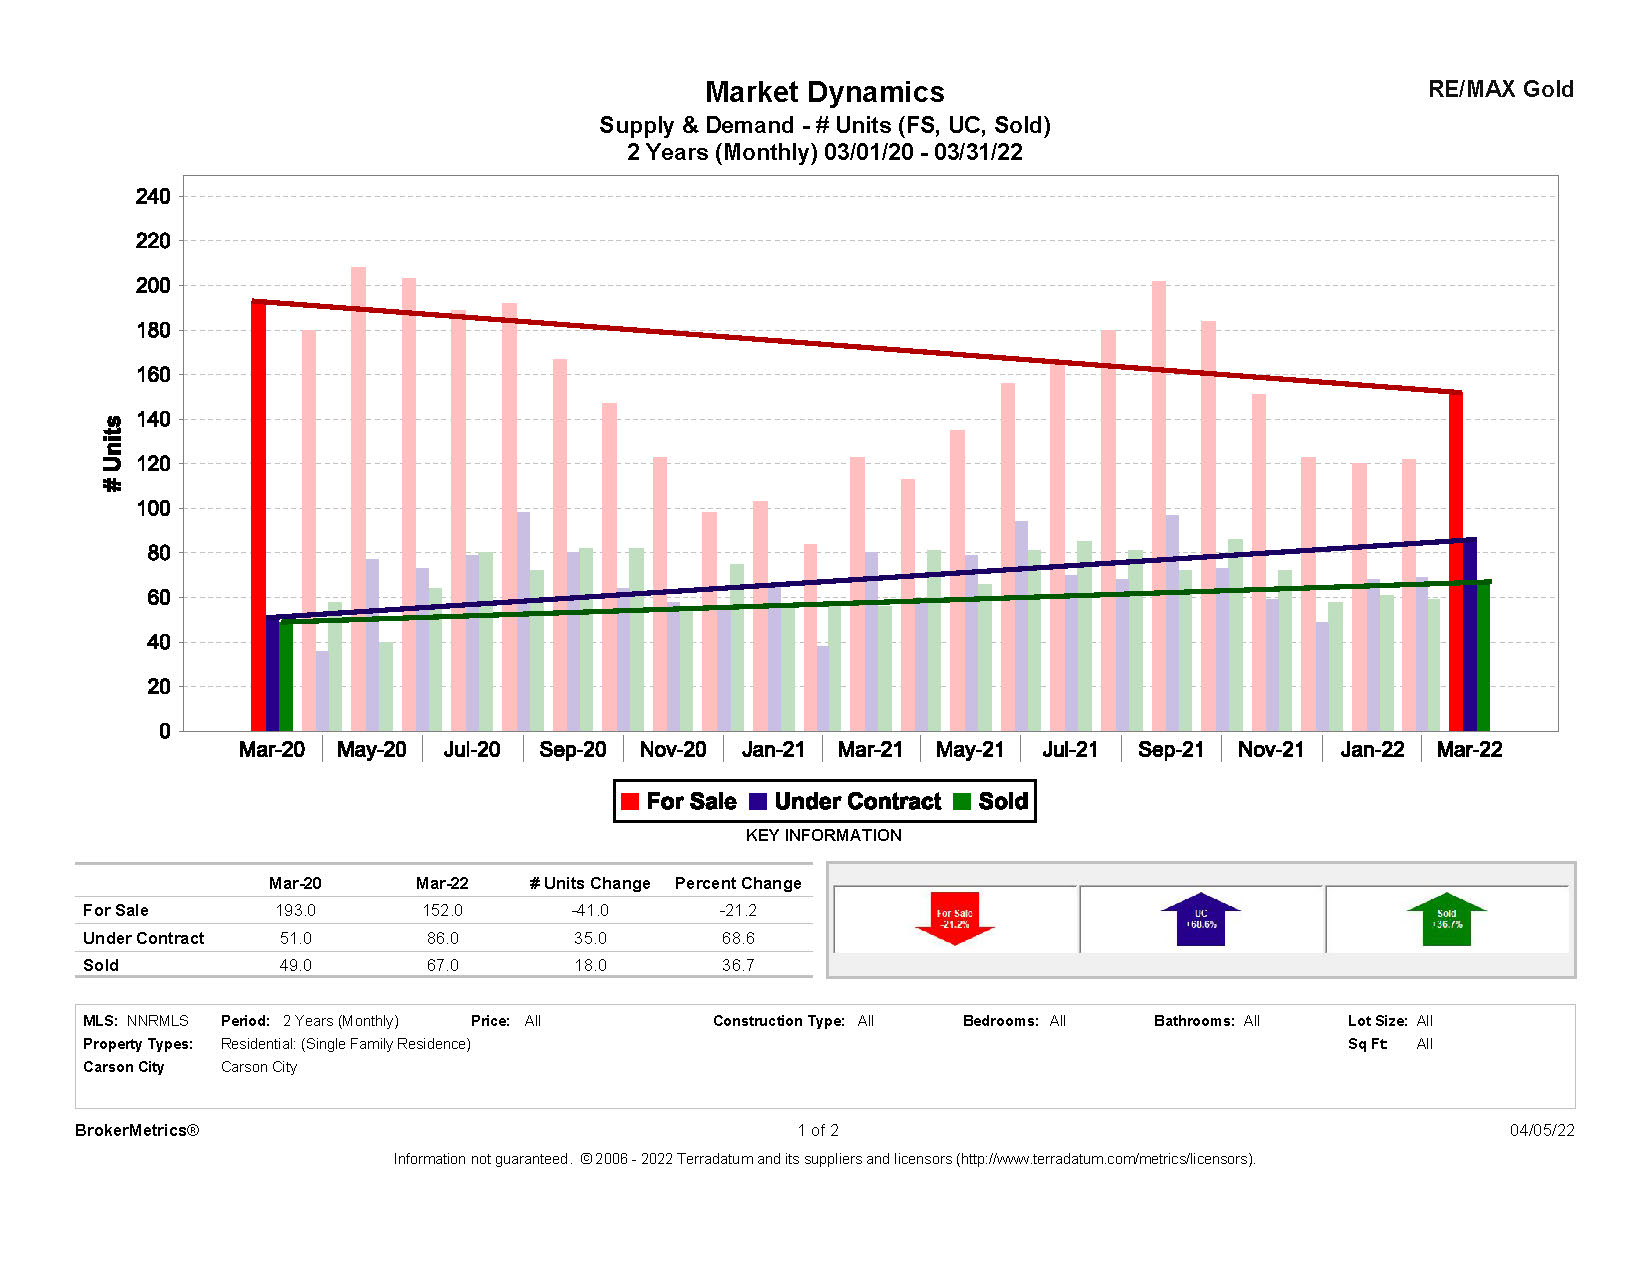
Minden, NV:
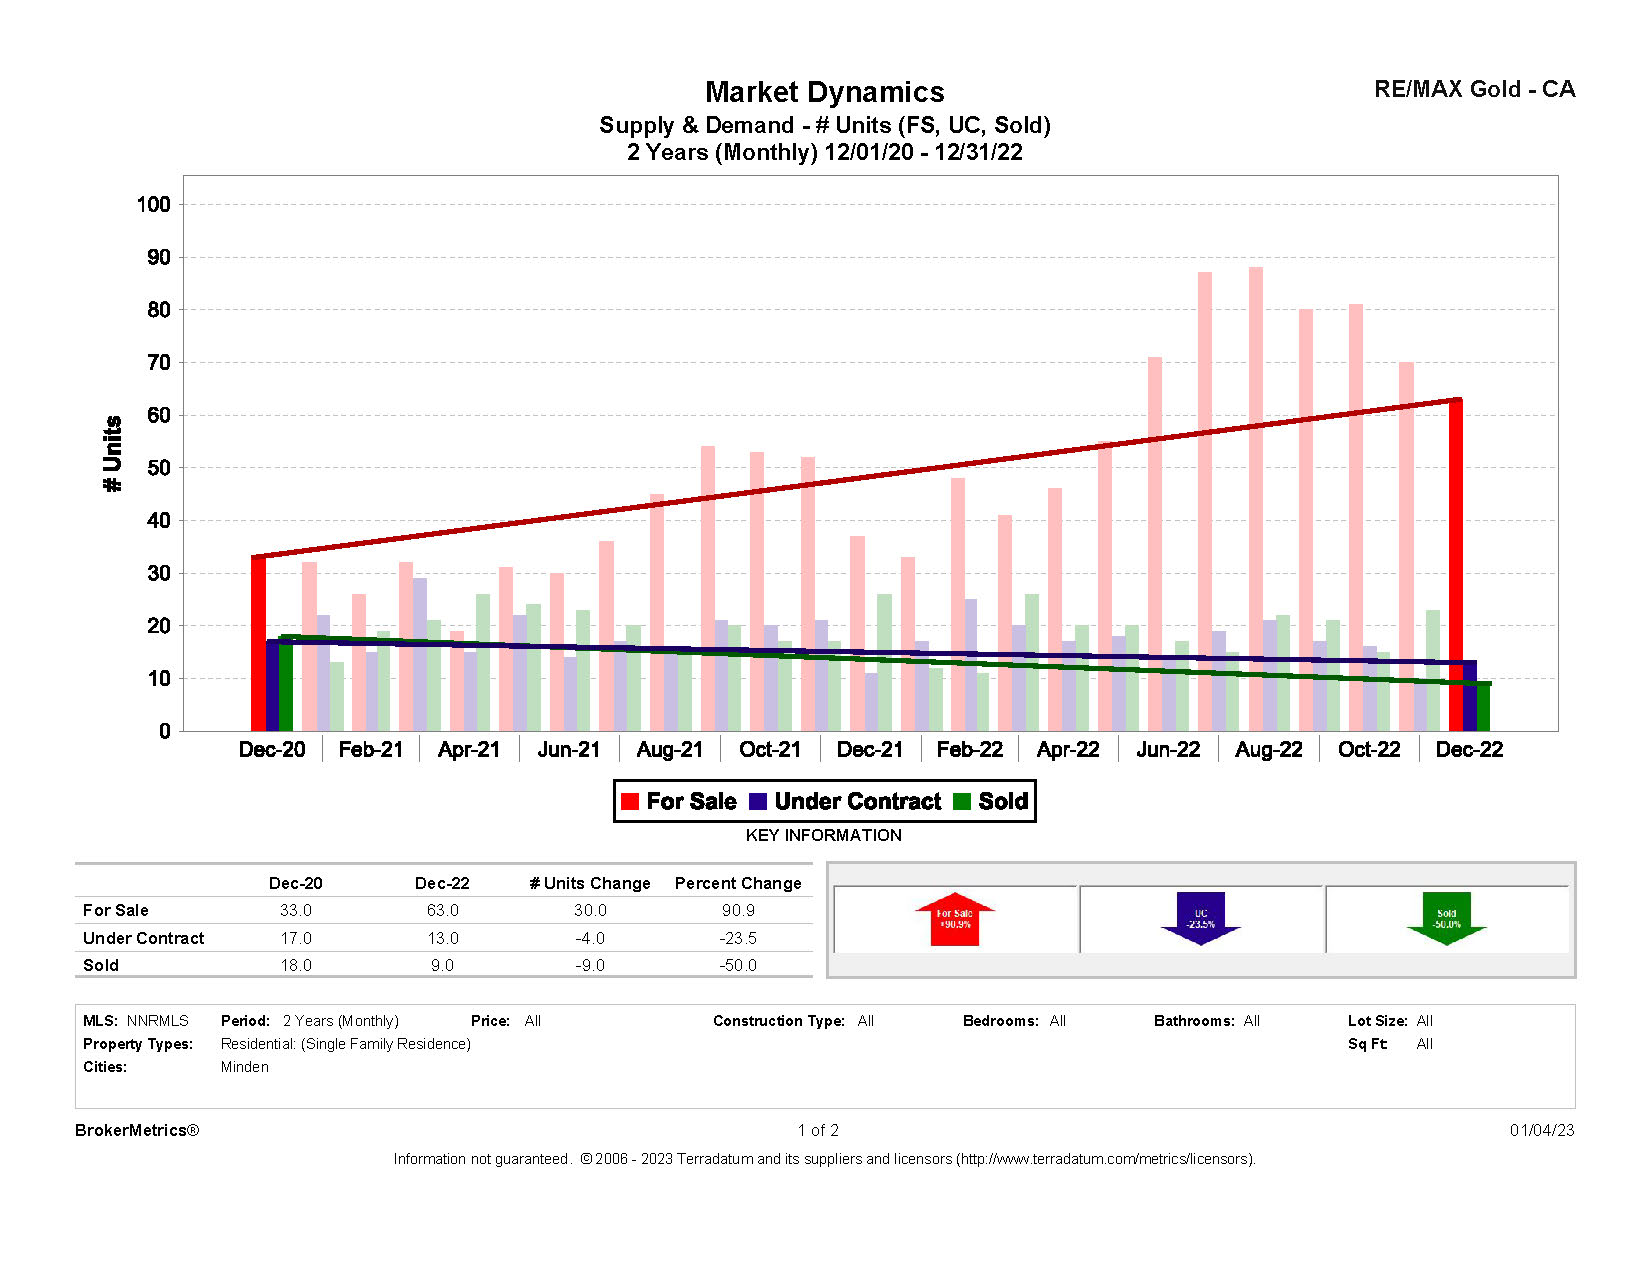
For the full December report for Minden, NV, click here.
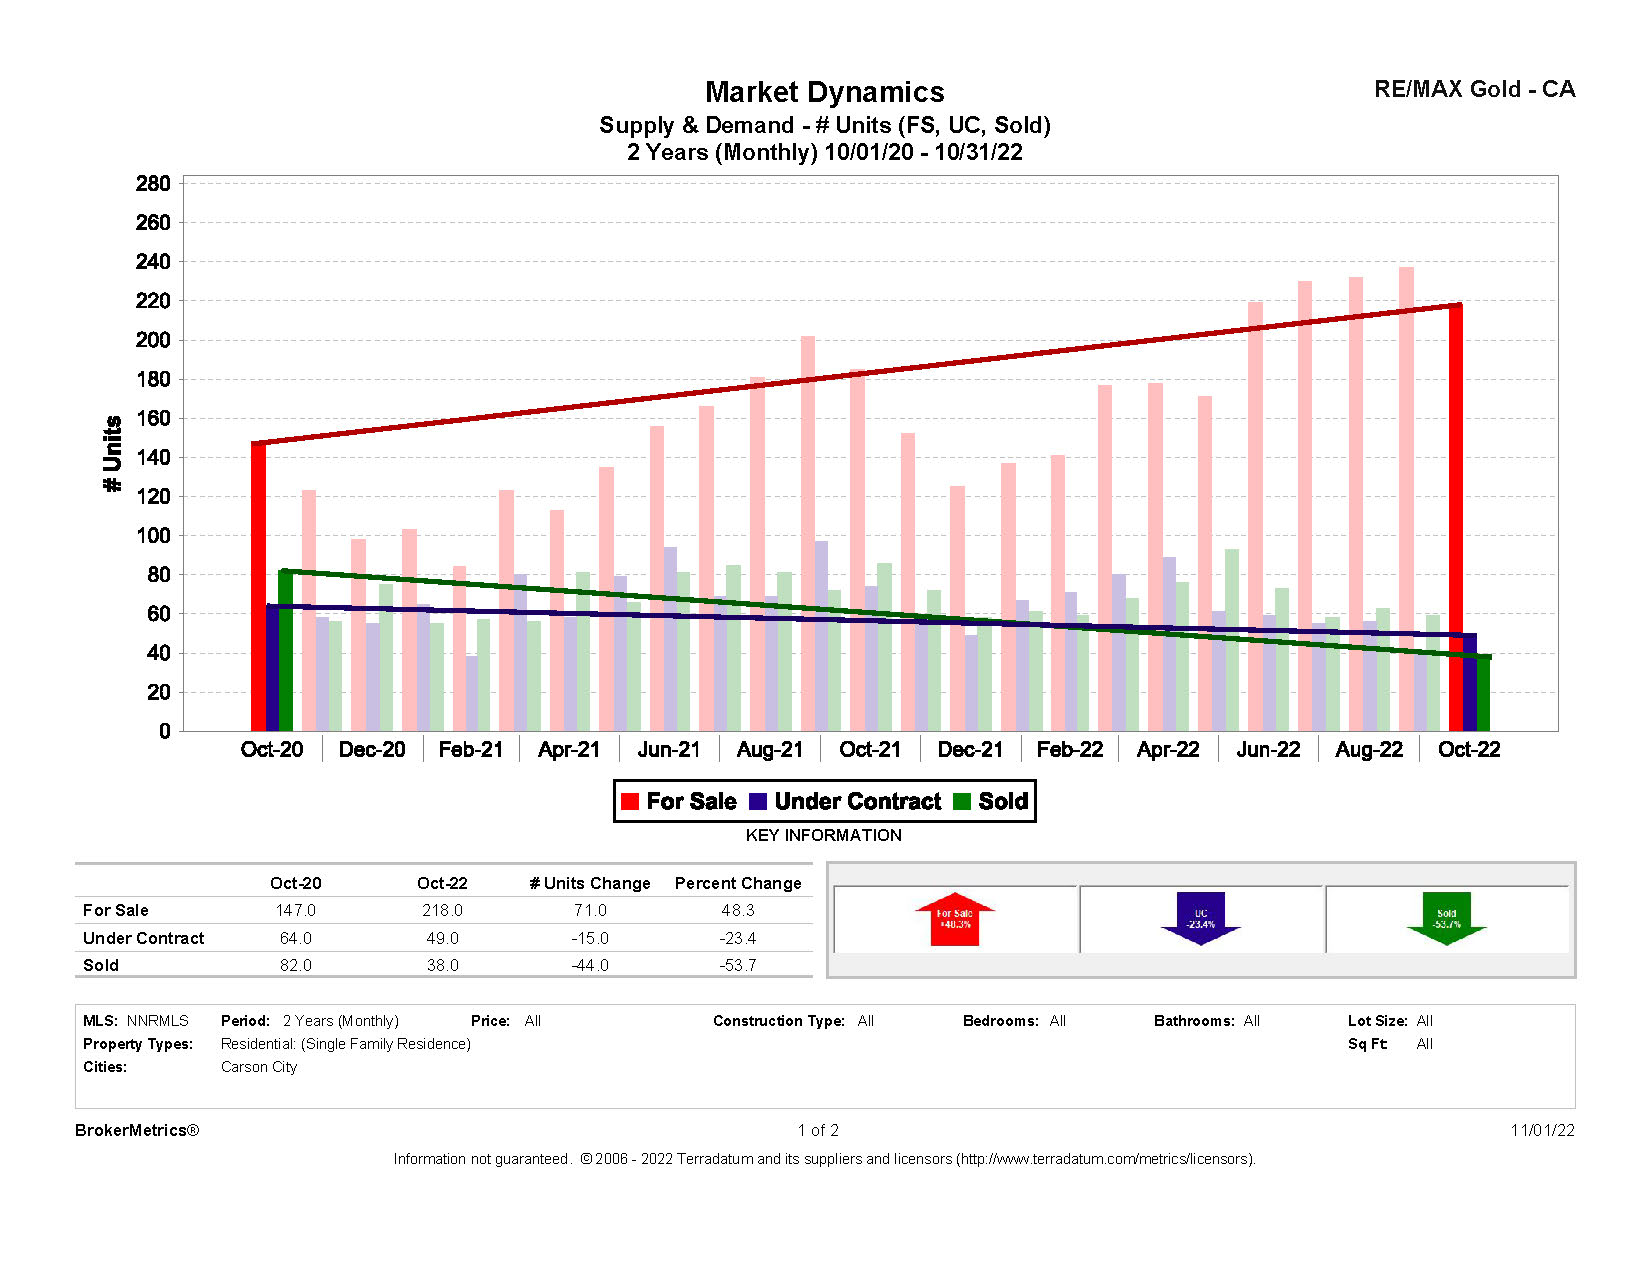
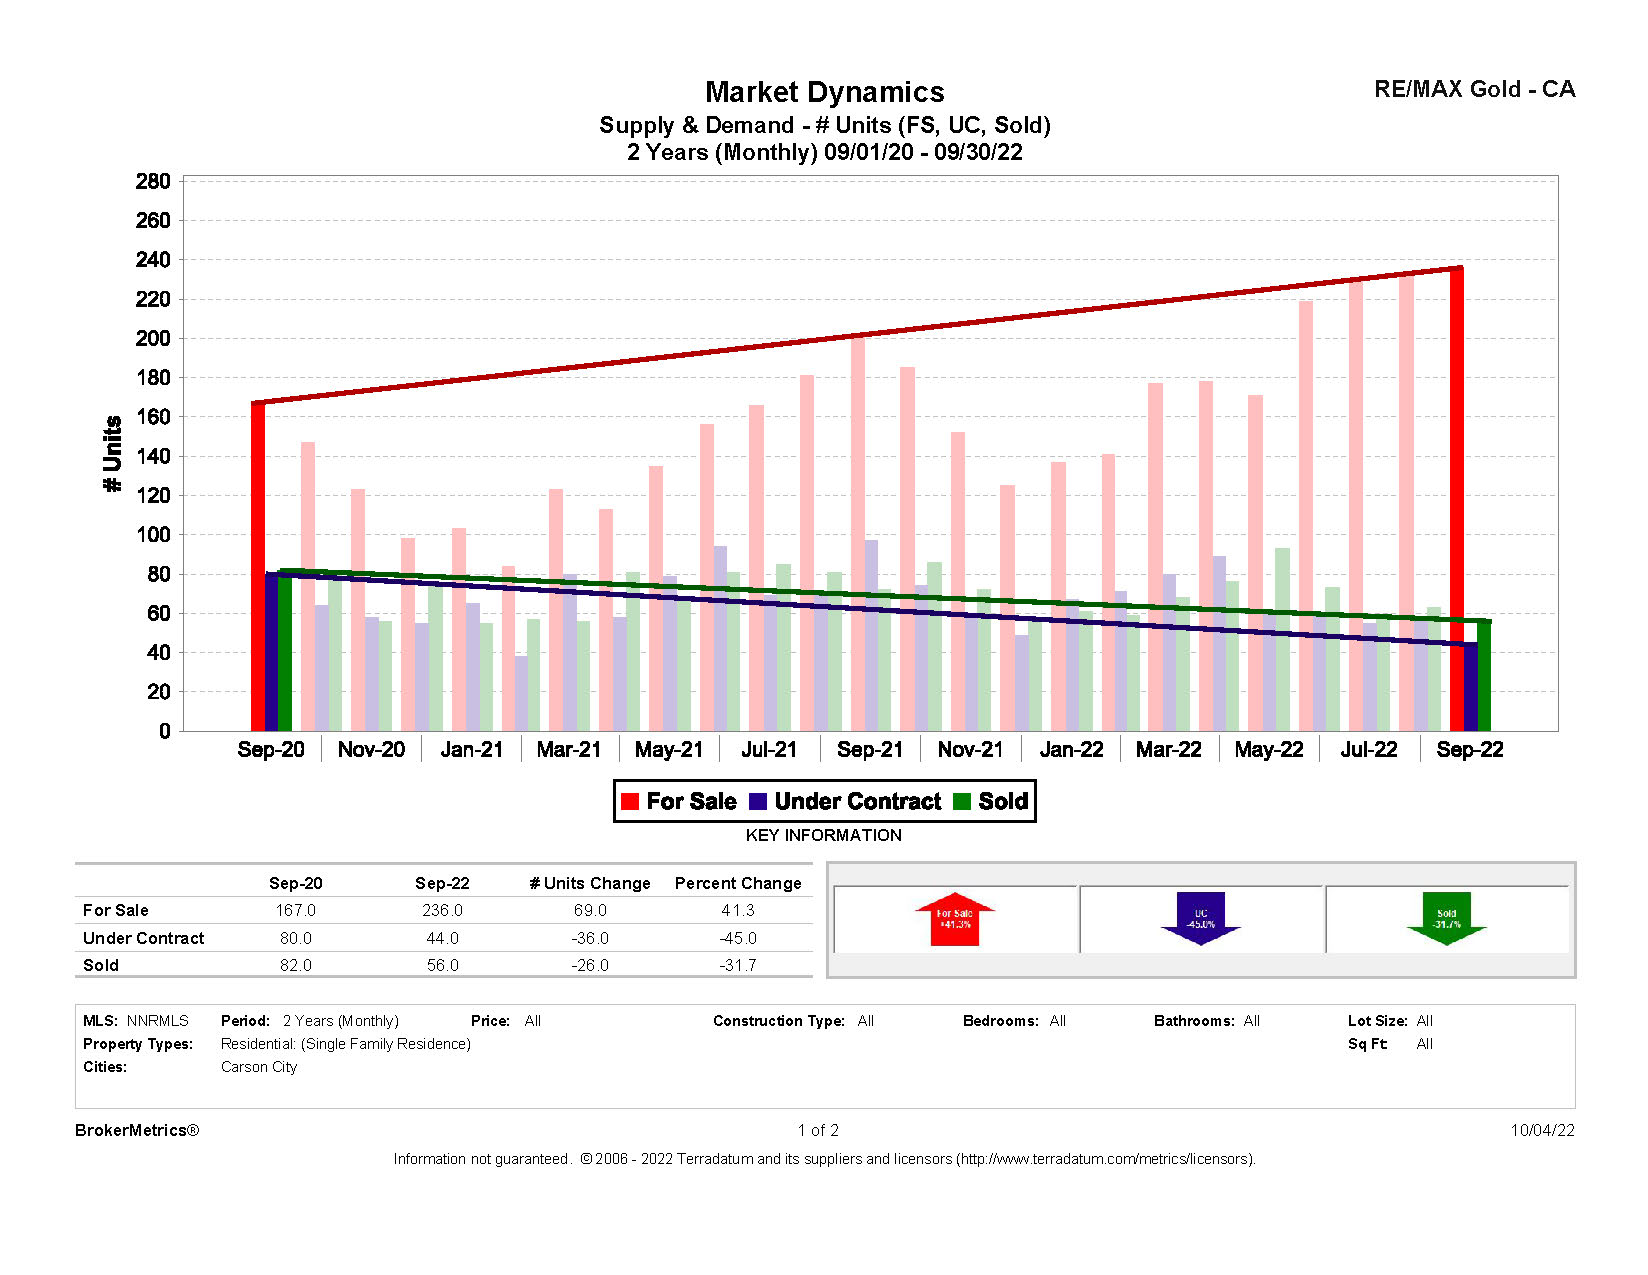
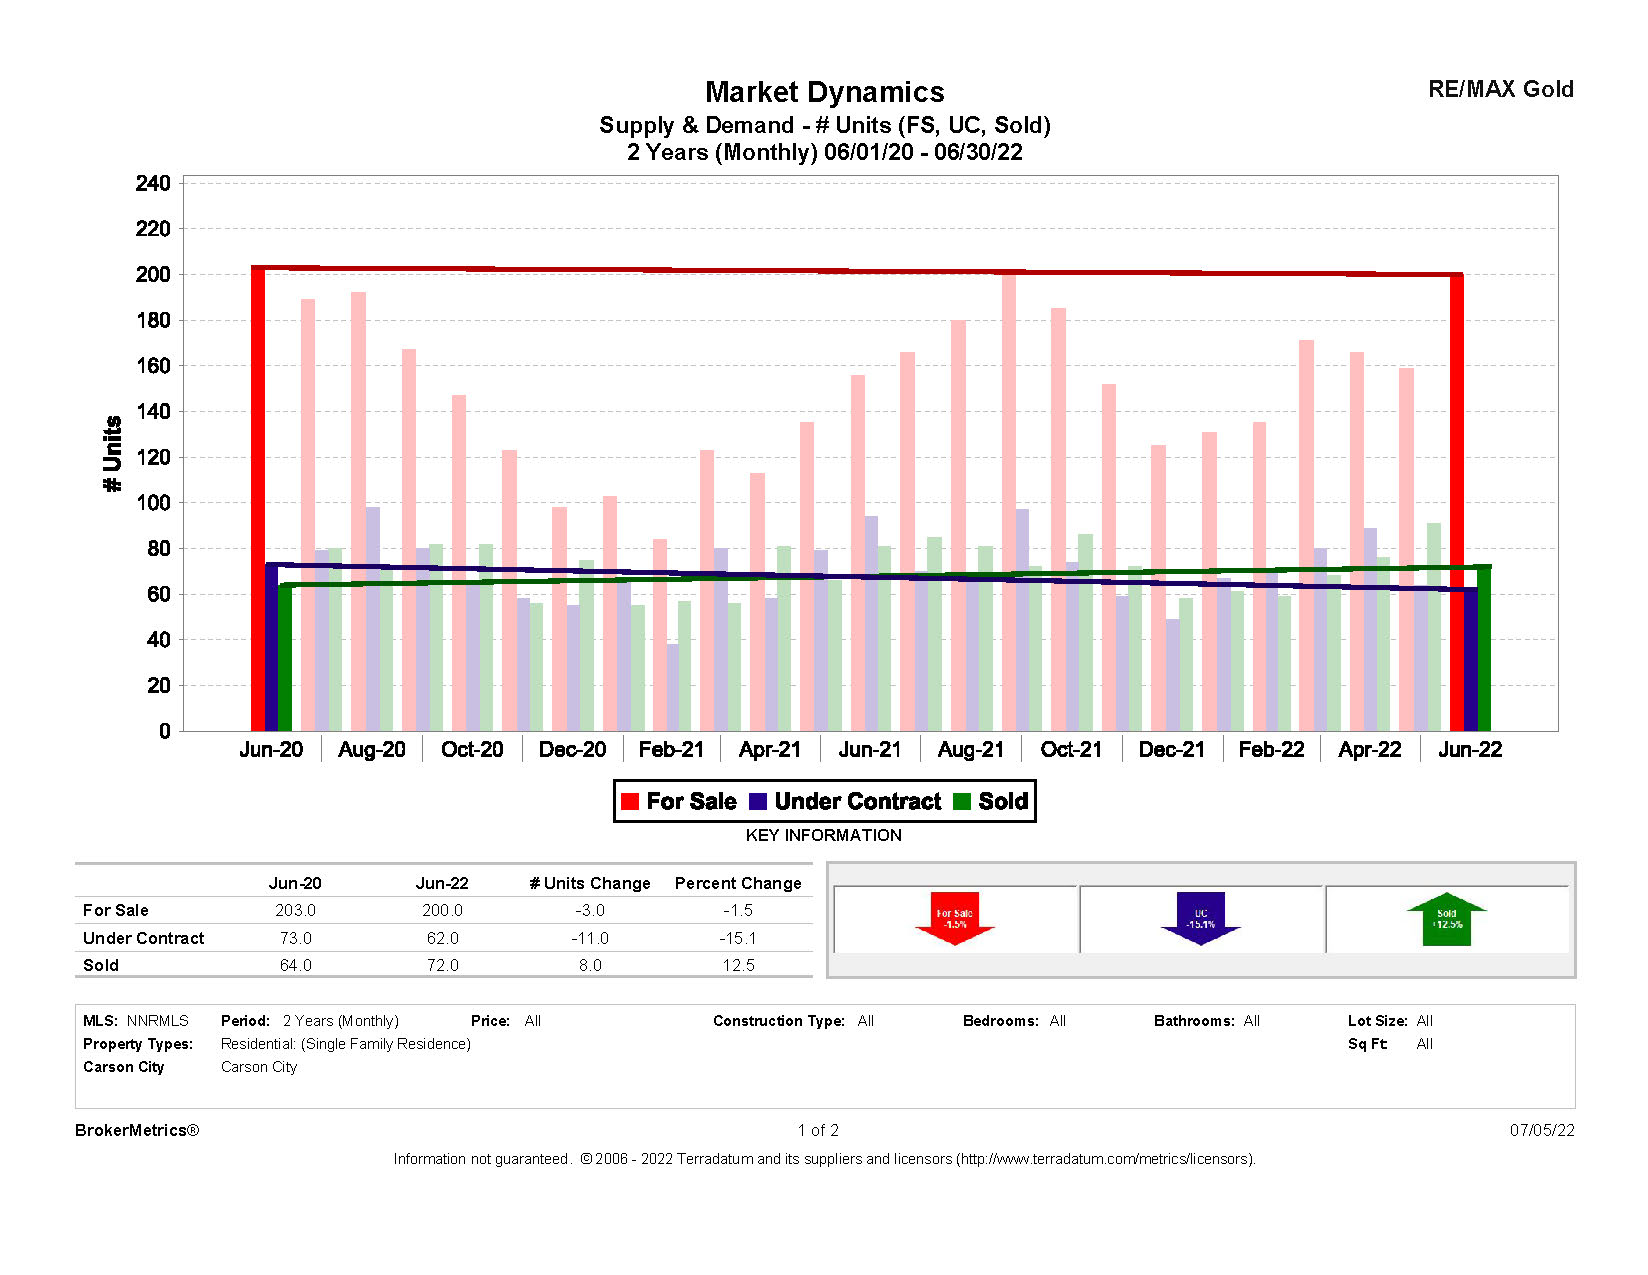
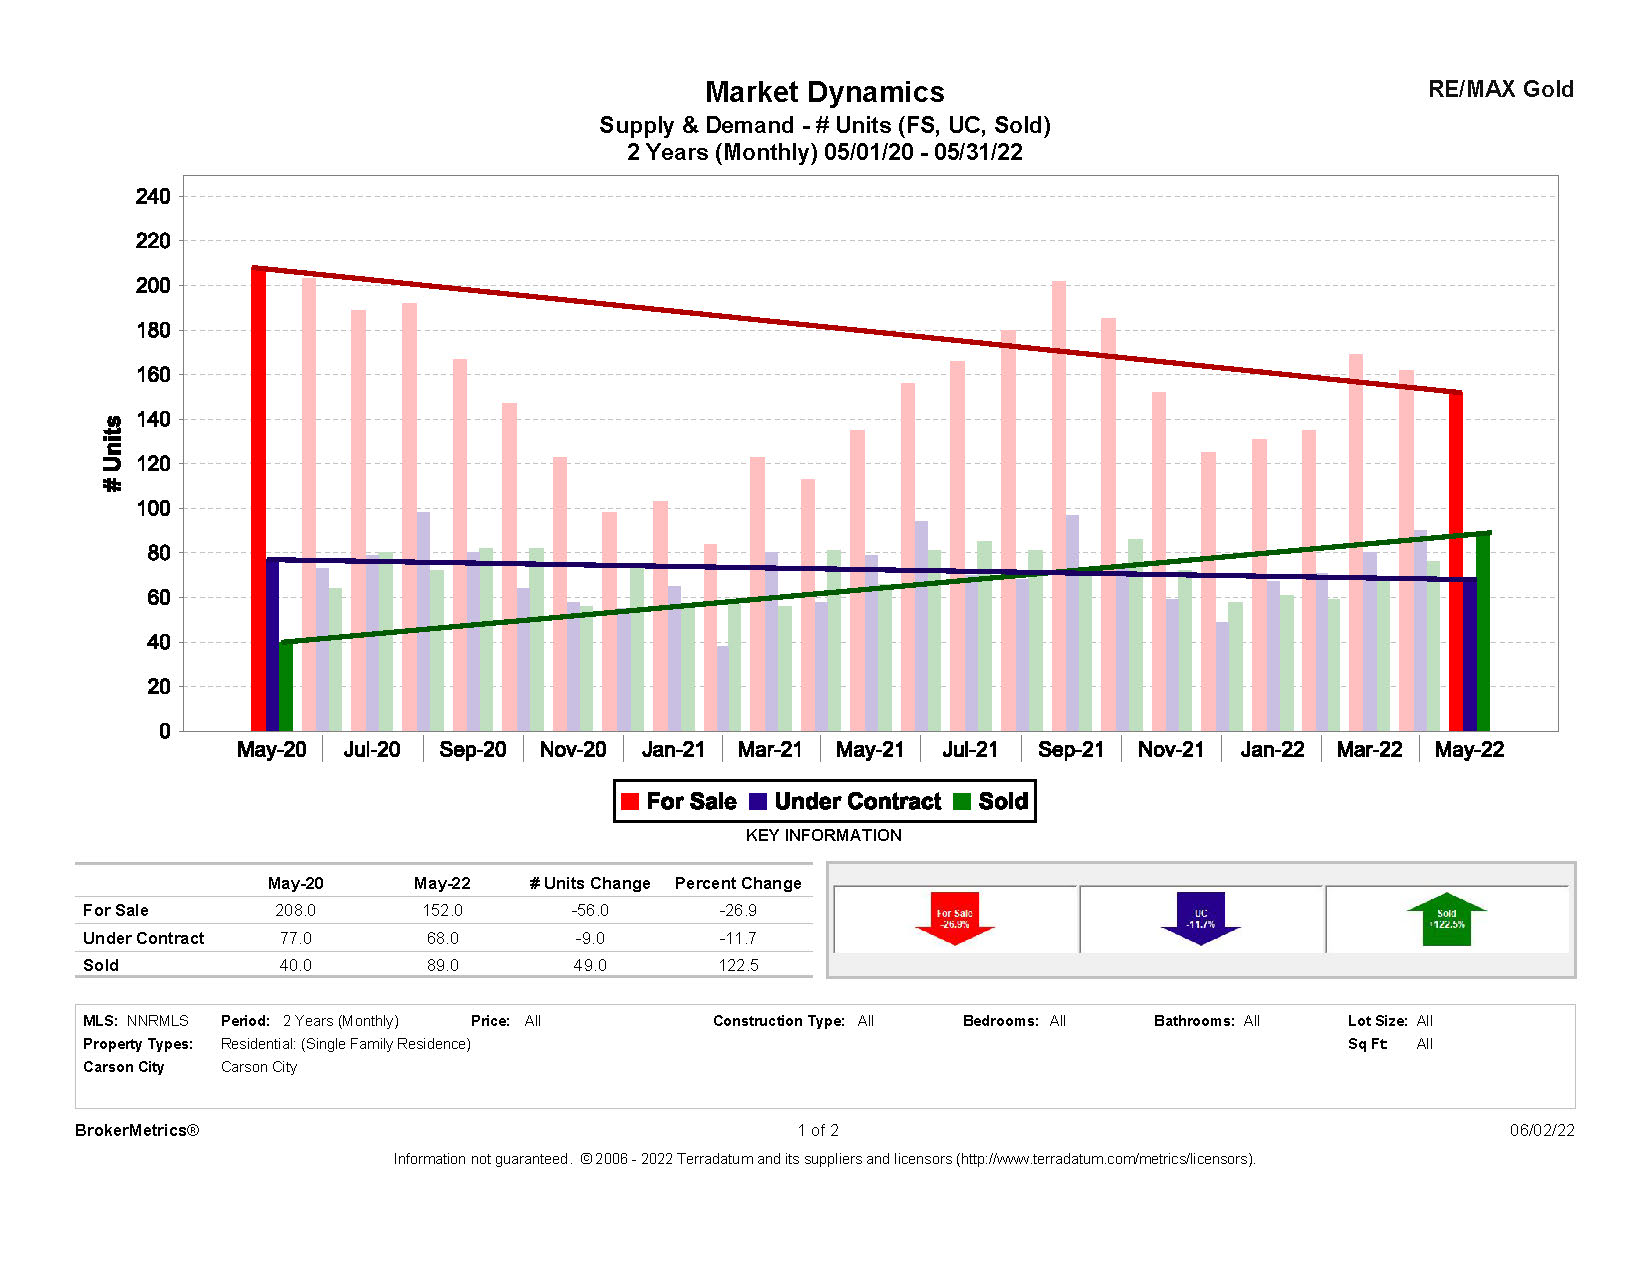
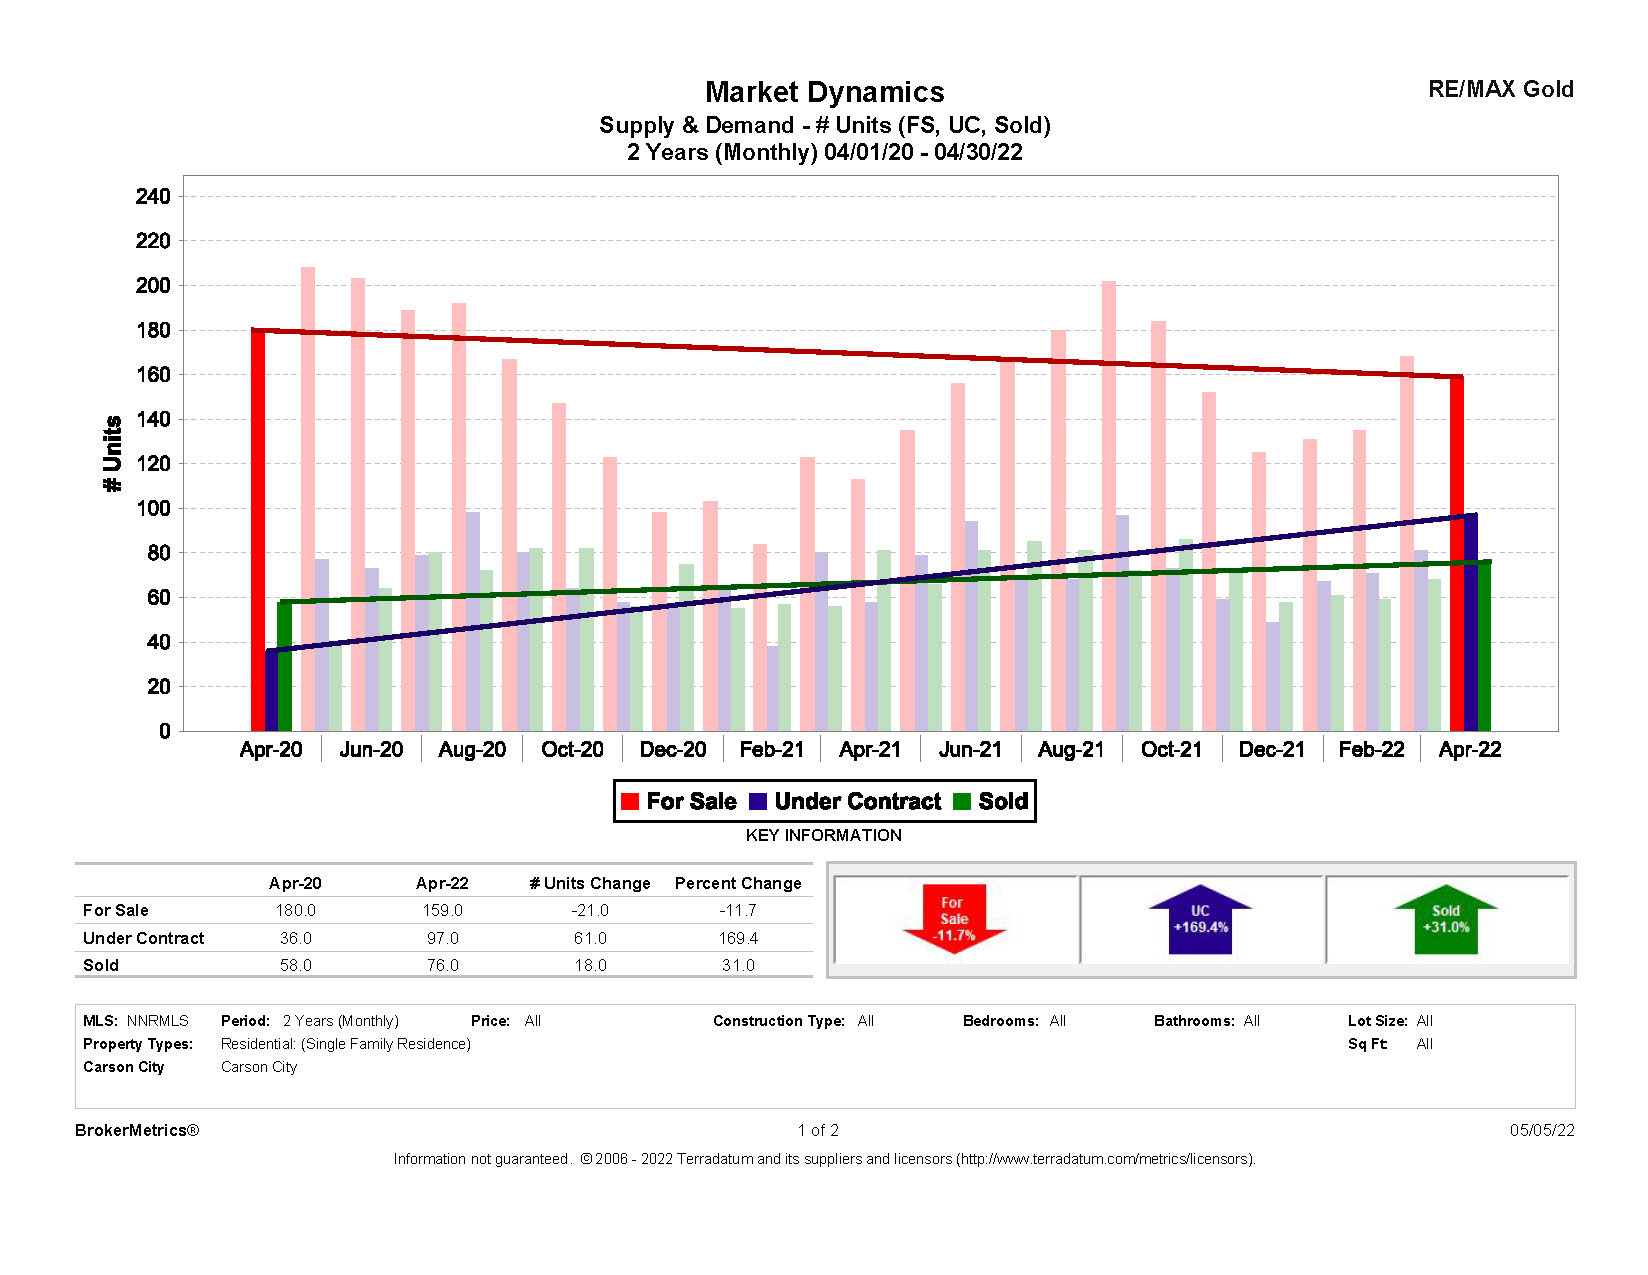
December 2022 Residential Stats for Carson City, NV:
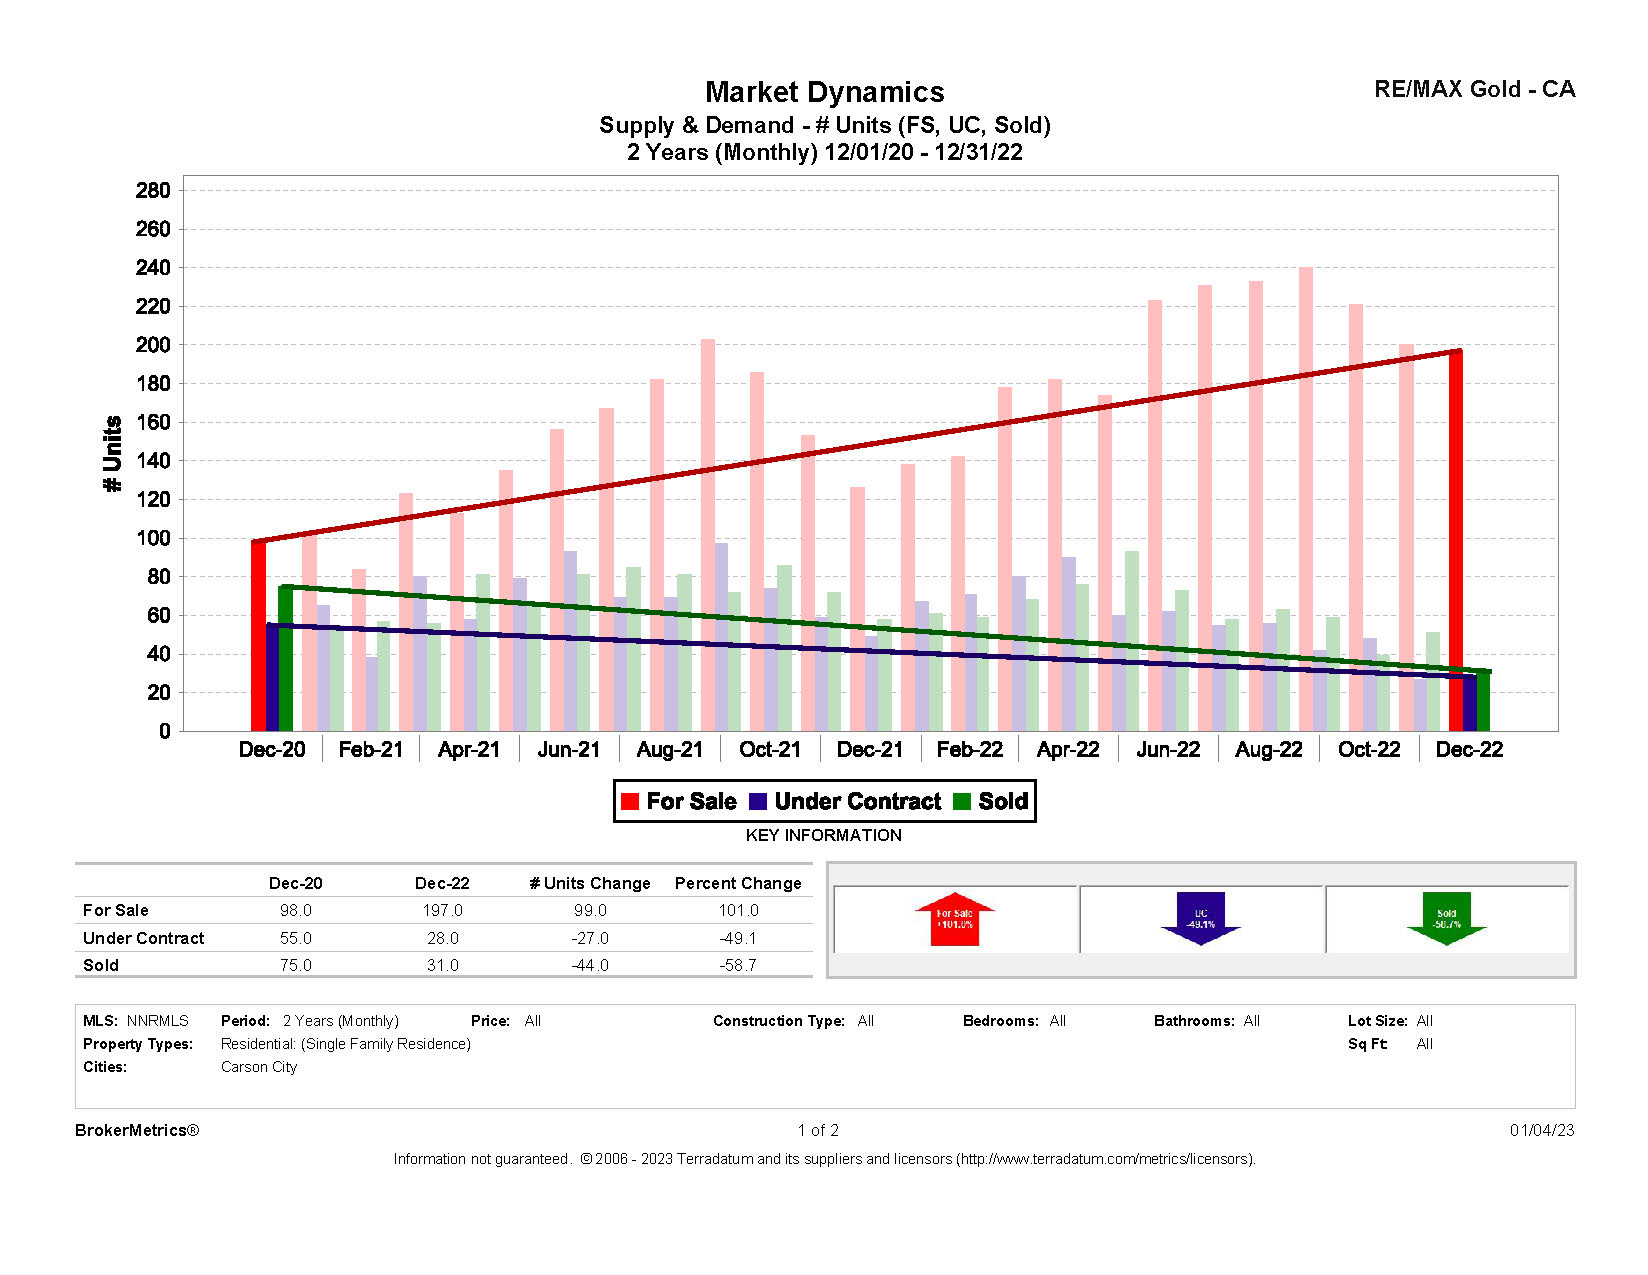
For the full December report for Carson City, NV, click here.
Thinking About Moving Here?
Are you thinking about moving to the Carson Valley area? If so, be sure to check out my Area Information Center for helpful links to the area. In addition, VisitCarsonValley.org is a great resource for all things Carson Valley. I think you will love it here!